Page 378 - NUMINO_WB_5B
P. 378
189_G5U32_G6U24_WB˜ ˙—» ¿º 2011.7.4 2:20 PM ˘ ` 12
189-B6-2
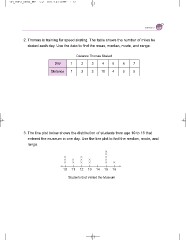
2. Thomas is training for speed skating. The table shows the number of miles he
skated each day. Use the data to find the mean, median, mode, and range.
Distance Thomas Skated
Day 1 2 3 4 5 6 7
Distance 1 2 3 10 4 5 5
3. The line plot below shows the distribution of students from age 10 to 15 that
entered the museum in one day. Use the line plot to find the median, mode, and
range.
10 11 12 13 14 15 16
Students that Visited the Museum


