Page 383 - NUMINO_WB_5B
P. 383
189_G5U32_G6U24_WB˜ ˙—» ¿º 2011.7.4 2:21 PM ˘ ` 17
189-P2-1
Triple-Bar Graph
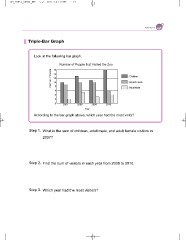
Look at the following bar graph.
Number of People that Visited the Zoo
Number of People 16 : Children
14 : Adult Female
12 : Adult Male
10
2008 2009 2010
8
6
4
2
0 2007
Year
According to the bar graph above, which year had the most visits?
Step 1. What is the sum of children, adult male, and adult female visitors in
2007?
Step 2. Find the sum of visitors in each year from 2008 to 2010.
Step 3. Which year had the most visitors?


