Page 386 - NUMINO_WB_5B
P. 386
189_G5U32_G6U24_WB˜ ˙—» ¿º 2011.7.4 2:21 PM ˘ ` 20
189-P3-2
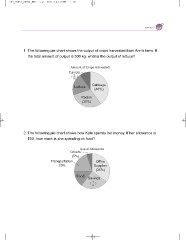
1. The following pie chart shows the output of crops harvested from Ann’s farm. If
the total amount of output is 500 kg, what is the output of lettuce?
Amount of Crops Harvested
Carrots
1
( 10 )
Lettuce Cabbage
(40%)
Radish
(30%)
2. The following pie chart shows how Kate spends her money. If her allowance is
$50, how much is she spending on food?
Use of Allowance
Others
(5%)
Transportation Office
20% Supplies
(35%)
Food Savings
( 1 )
4


