Page 387 - NUMINO_WB_5B
P. 387
189_G5U32_G6U24_WB˜ ˙—» ¿º 2011.7.4 2:21 PM ˘ ` 21
189-P4-1
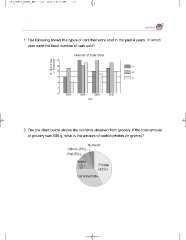
1. The following shows the types of cars that were sold in the past 4 years. In which
year were the least number of cars sold?
Number of cars Number of Cars Sold
(in thousands)
12
10 :A
8 :B
:C
6
4
2
0 2007 2008 2009 2010
Year
2. The pie chart below shows the nutrients obtained from grocery. If the total amount
of grocery was 500 g, what is the amount of carbohydrates (in grams)?
Nutrients
Others (5%)
Fat (8%)
Water Protein
(42%)
(3 )
25
Carbohydrate


