Page 23 - NUMINO_WB_6B
P. 23
190-P2-1
Stem-and-leaf Plot
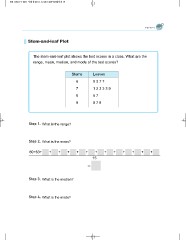
The stem-and-leaf plot shows the test scores in a class. What are the
range, mean, median, and mode of the test scores?
Stems Leaves
6 0377
7 123339
8 57
9 078
Step 1. What is the range?
Step 2. What is the mean?
60+63+ + + + + + + + + + + + +
15
=
Step 3. What is the median?
Step 4. What is the mode?
Stem-and-leaf Plot
The stem-and-leaf plot shows the test scores in a class. What are the
range, mean, median, and mode of the test scores?
Stems Leaves
6 0377
7 123339
8 57
9 078
Step 1. What is the range?
Step 2. What is the mean?
60+63+ + + + + + + + + + + + +
15
=
Step 3. What is the median?
Step 4. What is the mode?