Page 27 - NUMINO_WB_6B
P. 27
190-P4-1
1. Following is the income data of a shop from January to August. Find the mean,
median, and mode income and determine which value is most appropriate for
the representative value. Explain your answer.
Test scores of Thomas
Month Jan. Feb. Mar. Apr. May Jun. Jul. Aug.
Income 3400 1000 920 860 880 860 900 980
($)
range: 18
mean: 23
median: 23
mode: 32
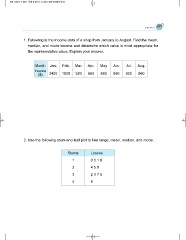
2. Use the following stem-and-leaf plot to find range, mean, median, and mode.
Stems Leaves
1 0118
2 459
3 2376
4 6
1. Following is the income data of a shop from January to August. Find the mean,
median, and mode income and determine which value is most appropriate for
the representative value. Explain your answer.
Test scores of Thomas
Month Jan. Feb. Mar. Apr. May Jun. Jul. Aug.
Income 3400 1000 920 860 880 860 900 980
($)
range: 18
mean: 23
median: 23
mode: 32
2. Use the following stem-and-leaf plot to find range, mean, median, and mode.
Stems Leaves
1 0118
2 459
3 2376
4 6