Page 24 - NUMINO_WB_6B
P. 24
190-P2-2
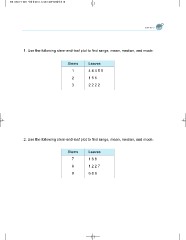
1. Use the following stem-and-leaf plot to find range, mean, median, and mode.
Stems Leaves
1 44459
2 156
3 2222
2. Use the following stem-and-leaf plot to find range, mean, median, and mode.
Stems Leaves
7 168
8 1227
9 689
1. Use the following stem-and-leaf plot to find range, mean, median, and mode.
Stems Leaves
1 44459
2 156
3 2222
2. Use the following stem-and-leaf plot to find range, mean, median, and mode.
Stems Leaves
7 168
8 1227
9 689