Page 43 - PlayFacto_P9
P. 43
Making graphs
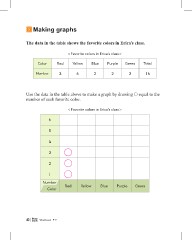
The data in the table shows the favorite colors in Erica’s class.
< Favorite colors in Erica’s class >
Color Red Yellow Blue Purple Green Total
Number 3 6 2 2 3 16
Use the data in the table above to make a graph by drawing equal to the
number of each favorite color.
< Favorite colors in Erica’s class >
6
5
4
3
2
1 Red Yellow Blue Purple Green
Number
Color
40 Workbook P-9