Page 45 - PlayFacto_P9
P. 45
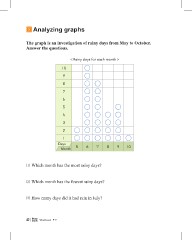
Analyzing graphs
The graph is an investigation of rainy days from May to October.
Answer the questions.
< Rainy days for each month > 10
10
9
8
7
6
5
4
3
2
1
Days
Month 5 6 7 8 9
⑴ Which month has the most rainy days?
⑵ Which month has the fewest rainy days?
⑶ How many days did it had rain in July?
42 Workbook P-9
The graph is an investigation of rainy days from May to October.
Answer the questions.
< Rainy days for each month > 10
10
9
8
7
6
5
4
3
2
1
Days
Month 5 6 7 8 9
⑴ Which month has the most rainy days?
⑵ Which month has the fewest rainy days?
⑶ How many days did it had rain in July?
42 Workbook P-9