Page 42 - PlayFacto_P9
P. 42
Table and graph
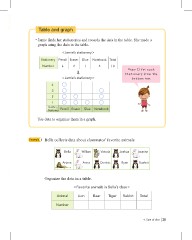
Jamie finds her stationeries and records the data in the table. She made a
graph using the data in the table.
< Jamie’s stationery >
Stationery Pencil Eraser Glue Notebook Total
Number 4 2 1 3 10
< Jamie’s stationery > Draw for each
stationery from the
bottom row.
4
3
2
1
Number Pencil Eraser Glue Notebook
Stationery
Use data to organize them in a graph.
Example 1 Bella collects data about classmates’ favorite animals.
Bella William Victoria Joshua Jasmine
Ariana Anna Dominic Ryan Scarlett
Organize the data in a table.
< Favorite animals in Bella’s class >
Animal Lion Bear Tiger Rabbit Total
Number
4. Sum of dice 39