
Page 61 - QEB_2_2016_lowres
P. 61
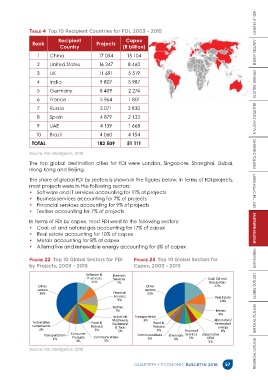
Table 4  Top 10 Recipient Countries for FDI, 2003 – 2015
                           Recipient                     Capex
               Rank                         Projects
                            Country                     (R billion)

                 1     China                 17 054      15 104
                 2     United States         16 247       8 460
                 3     UK                    11 691       5 519

                 4     India                 9 807        5 987
                 5     Germany               8 409        2 274

                 6     France                5 964        1 801
                 7     Russia                5 071        3 830

                 8     Spain                 4 879        2 133
                 9     UAE                   4 139        1 668
                 10    Brazil                4 060        4 154

               TOTAL                        182 509      51 111

              Source: FDI Intelligence, 2016
              The top global destination cities for FDI were London, Singapore, Shanghai, Dubai,
              Hong Kong and Beijing.

              The share of global FDI by sectors is shown in the figures below. In terms of FDI projects,
              most projects were in the following sectors:
              •  Software and IT services accounting for 11% of projects                                           PROVINCIAL OUTLOOK      NATIONAL OUTLOOK      GLOBAL OUTLOOK      GAP HOUSING      INVESTOR NARRATIVE      SPOT THE OPPORTUNITY      PORTFOLIO INSIGHTS      KHULISA NEWSLETTER      ELECTRIC VEHICLES      ENERGY SECURITY      LOOKING AT GDP
              •  Business services accounting for 7% of projects
              •  Financial services accounting for 9% of projects
              •  Textiles accounting for 7% of projects
              In terms of FDI by capex, most FDI went to the following sectors:
              •  Coal, oil and natural gas accounting for 17% of capex
              •  Real estate accounting for 10% of capex
              •  Metals accounting for 8% of capex
              •  Alternative and renewable energy accounting for 6% of capex

              Figure 22  Top 10 Global Sectors for FDI       Figure 23  Top 10 Global Sectors for
              by Projects, 2003 – 2015                       Capex, 2003 – 2015
                                       Software &  Business
                                        IT services  Services                                Coal, Oil and
                                         11%         7%                                       Natural Gas
                  Other                                           Other                         17%
                  sectors                                         sectors
                   39%                             Financial      33%
                                                    Services                                     Real Estate
                                                     9%                                            10%
                                                   Textiles
                                                    7%                                           Metals
                                                                                                  8%
                                                   Industrial   Transportation
                                                   Machinery,    3%                             Alternative/
                Automative                Food &   Equipment         Food &                     Renewable
               components                Tobacco    & Tools          Tobacco                      energy
                  4%                       5%         5%               3%          Financial       6%
                     Transportation  Consumer   Communications  Communications   Chemicals   Services   Automative
                        4%       Products                          5%         5%     5%      OEM
                                   4%          5%                                             5%
              Source: FDI Intelligence, 2016


                                                             QUARTERLY ECONOMIC BULLETIN 2016        57