
Page 62 - QEB_2_2016_lowres
P. 62
South Africa FDI trends
INWARD FDI
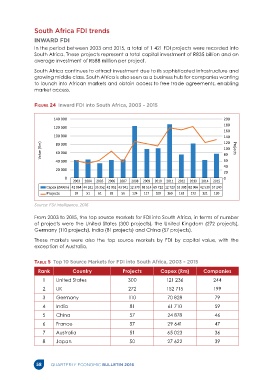
In the period between 2003 and 2015, a total of 1 421 FDI projects were recorded into
South Africa. These projects represent a total capital investment of R835 billion and an
average investment of R588 million per project.
South Africa continues to attract investment due to its sophisticated infrastructure and
growing middle class. South Africa is also seen as a business hub for companies wanting
to launch into African markets and obtain access to free trade agreements, enabling
market access.
Figure 24 Inward FDI into South Africa, 2003 – 2015
140 000 200
180
120 000
160
100 000 140
120
Value (Rm) 80 000 100 Projects
60 000
80
40 000 60
40
20 000
20
0 0
2003 2004 2005 2006 2007 2008 2009 2010 2011 2012 2013 2014 2015
Capex (ZARm) 42 864 44 181 35 352 42 052 43 941 12 370 68 514 69 722 12 723 53 398 82 066 42 539 57 240
Projects 59 51 61 89 56 124 117 109 169 163 172 121 130
Source: FDI Intelligence, 2016
From 2003 to 2015, the top source markets for FDI into South Africa, in terms of number
of projects were the United States (300 projects), the United Kingdom (272 projects),
Germany (110 projects), India (81 projects) and China (57 projects).
These markets were also the top source markets by FDI by capital value, with the
exception of Australia.
Table 5 Top 10 Source Markets for FDI into South Africa, 2003 – 2015
Rank Country Projects Capex (Rm) Companies
1 United States 300 121 236 244
2 UK 272 152 715 199
3 Germany 110 70 828 79
4 India 81 61 710 59
5 China 57 24 878 46
6 France 57 29 641 47
7 Australia 51 65 023 36
8 Japan 50 27 622 39
58 QUARTERLY ECONOMIC BULLETIN 2016