Page 63 - QEB_2_2016_lowres
P. 63

Rank           Country               Projects         Capex (Rm)         Companies

                  9     Switzerland                       45              27 464                32
                 10     Netherlands                       42              15 975                38

               Other Countries                           356             238 731               291
               TOTAL                                   1 421             835 823             1 110

              Source: FDI Intelligence, 2015

              The best performing sectors in attracting FDI from abroad to South Africa, from 2003 to
              2015, by number of projects and capex are shown below.

              In terms of FDI projects, most projects were in the following sectors:
              •  Software and IT services accounting for 12% of projects
              •  Business services accounting for 12% of projects
              •  Financial services accounting for 9% of projects
              •  Communications accounting for 7% of projects
              In terms of FDI by capex, most FDI went to the following sectors:
              •  Metals accounting for 18% of capex
              •  Alternative and renewable energy accounting for 17% of capex
              •  Coal, oil and natural gas accounting for 14% of capex
              •  Automotive OEM accounting for 9% share of capex
              These  sectors  were  among  the  top  five  global  sectors  attracting  FDI,  meaning  that
              South Africa’s sectors for FDI were in line with global sectors.                                     PROVINCIAL OUTLOOK      NATIONAL OUTLOOK      GLOBAL OUTLOOK      GAP HOUSING      INVESTOR NARRATIVE      SPOT THE OPPORTUNITY      PORTFOLIO INSIGHTS      KHULISA NEWSLETTER      ELECTRIC VEHICLES      ENERGY SECURITY      LOOKING AT GDP


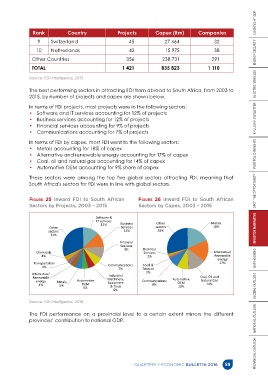
              Figure  25  Inward FDI to South African          Figure  26  Inward FDI to South African
              Sectors by Projects, 2003 – 2015                 Sectors by Capex, 2003 – 2015


                                            Software &
                                            IT services                Other                   Metals
                                              12%      Business
                       Other                           Services       sectors                   18%
                       sectors                          12%            29%
                       32%
                                                      Financial
                                                       Services
                                                        9%       Business
                 Chemicals                                       Services                       Alternative/
                   4%                                             2%                            Renewable
                                                                                                  energy
                Transportation                   Communications  Food &                           17%
                    4%                                7%        Tobacco
               Alternative/                      Industrial       2%
                Renewable                        Machinery,                   Automative  Coal, Oil and
                 energy   Metals   Automotive    Equipment      Communications   OEM      Natural Gas
                  4%       5%        OEM          & Tools            8%         10%          14%
                                      5%
                                                   6%

              Source: FDI Intelligence, 2016

              The FDI performance on a provincial level to a certain extent mirrors the different
              provinces’ contribution to national GDP.


                                                             QUARTERLY ECONOMIC BULLETIN 2016        59
   58   59   60   61   62   63   64   65   66   67   68