
Page 68 - QEB_2_2016_lowres
P. 68
From 2003 to 2015, the best performing sectors in attracting FDI from abroad to the
Western Cape by number of projects, were software and IT services and business
services (with 48 and 47 projects respectively).
In terms of capex, the sectors that performed the best over the 11 year period were
coal, oil and natural gas (R21 billion) and alternative/renewable energy (R20 billion).
The sector that accounted for the highest number of job creation through FDI activity
was textiles, with an average of 284 jobs per project. This was followed by consumer
goods at 281 jobs per project.
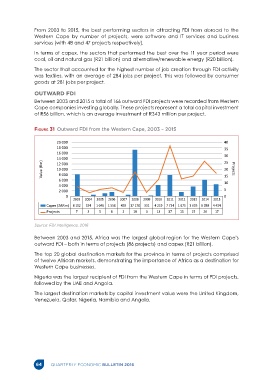
OUTWARD FDI
Between 2003 and 2015 a total of 166 outward FDI projects were recorded from Western
Cape companies investing globally. These projects represent a total capital investment
of R56 billion, which is an average investment of R343 million per project.
Figure 31 Outward FDI from the Western Cape, 2003 – 2015
20 000 40
18 000 35
16 000 30
14 000 25
Value (Rm) 10 000 20 Projects
12 000
8 000
6 000 15
10
4 000
2 000 5
0 0
2003 2004 2005 2006 2007 2008 2009 2010 2011 2012 2013 2014 2015
Capex (ZARm) 8 102 524 1 046 1 558 428 17 178 331 4 219 7 734 1 675 3 605 6 089 4 434
Projects 7 3 5 6 3 18 3 13 37 13 15 26 17
Source: FDI Intelligence, 2016
Between 2003 and 2015, Africa was the largest global region for the Western Cape’s
outward FDI – both in terms of projects (86 projects) and capex (R21 billion).
The top 20 global destination markets for the province in terms of projects comprised
of twelve African markets, demonstrating the importance of Africa as a destination for
Western Cape businesses.
Nigeria was the largest recipient of FDI from the Western Cape in terms of FDI projects,
followed by the UAE and Angola.
The largest destination markets by capital investment value were the United Kingdom,
Venezuela, Qatar, Nigeria, Namibia and Angola.
64 QUARTERLY ECONOMIC BULLETIN 2016