
Page 67 - QEB_2_2016_lowres
P. 67
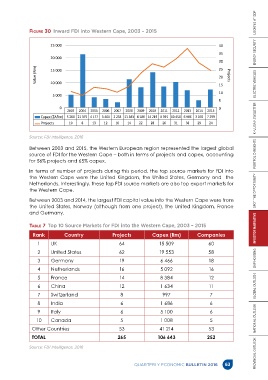
Figure 30  Inward FDI into Western Cape, 2003 – 2015


                       25 000                                                                     40
                                                                                                  35
                       20 000
                                                                                                  30
                 Value (Rm)  15 000                                                               25  Projects

                                                                                                  20
                       10 000
                                                                                                  15
                                                                                                  10
                        5 000
                                                                                                  5
                            0                                                                     0
                               2003  2004  2005  2006  2007  2008  2009  2010  2011  2012  2013  2014  2015
                    Capex (ZARm) 5 260 21 375 4 177 3 404 2 233 11 583 8 180 14 219 8 391 10 450 6 986 3 076 7 299
                    Projects    10   8    13   12   10    14   22   28   26   31    38   29   24


              Source: FDI Intelligence, 2016

              Between 2003 and 2015, the Western European region represented the largest global
              source of FDI for the Western Cape – both in terms of projects and capex, accounting
              for 56% projects and 65% capex.
              In terms of number of projects during this period, the top source markets for FDI into
              the  Western  Cape  were  the  United  Kingdom,  the  United  States,  Germany  and    the
              Netherlands. Interestingly, these top FDI source markets are also top export markets for
              the Western Cape.                                                                                    PROVINCIAL OUTLOOK      NATIONAL OUTLOOK      GLOBAL OUTLOOK      GAP HOUSING      INVESTOR NARRATIVE      SPOT THE OPPORTUNITY      PORTFOLIO INSIGHTS      KHULISA NEWSLETTER      ELECTRIC VEHICLES      ENERGY SECURITY      LOOKING AT GDP

              Between 2003 and 2014, the largest FDI capital value into the Western Cape were from
              the United States, Norway (although from one project), the United Kingdom, France
              and Germany.


              Table 7  Top 10 Source Markets for FDI into the Western Cape, 2003 – 2015
                Rank          Country              Projects          Capex (Rm)          Companies

                  1     UK                            64                15 509                60
                  2     United States                 62                19 553                58
                  3     Germany                       19                6 466                 18

                  4     Netherlands                   16                5 092                 16
                  5     France                        14                8 384                 12
                  6     China                         12                1 634                 11

                  7     Switzerland                    8                 997                  7
                  8     India                          6                1 686                 6

                  9     Italy                          6                5 100                 6
                 10     Canada                         5                1 008                 5
               Other Countries                        53                41 214                53
               TOTAL                                 265               106 643               252


              Source: FDI Intelligence, 2016


                                                             QUARTERLY ECONOMIC BULLETIN 2016        63