
Page 71 - QEB_2_2016_lowres
P. 71
Purchasing property is often one of the key investment areas for large financial
institutions. Thus, understanding the property market context is without a doubt very
important for both business and investors. With a common understanding, business
and investors can conceive opportunities, imagine solutions, and build a better, more
intentional future, while broadening the housing opportunities available to even our
lowest income residents.
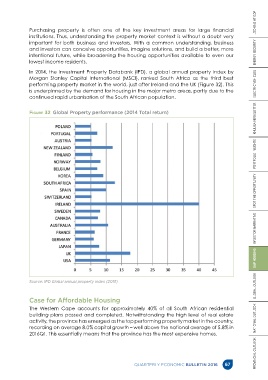
In 2014, the Investment Property Databank (IPD), a global annual property index by
Morgan Stanley Capital International (MSCI), ranked South Africa as the third best
performing property market in the world, just after Ireland and the UK (Figure 32). This
is underpinned by the demand for housing in the major metro areas, partly due to the
continued rapid urbanisation of the South African population.
Figure 32 Global Property performance (2014 Total return) PROVINCIAL OUTLOOK NATIONAL OUTLOOK GLOBAL OUTLOOK GAP HOUSING INVESTOR NARRATIVE SPOT THE OPPORTUNITY PORTFOLIO INSIGHTS KHULISA NEWSLETTER ELECTRIC VEHICLES ENERGY SECURITY LOOKING AT GDP
Source: IPD Global annual property index (2015)
Case for Affordable Housing
The Western Cape accounts for approximately 40% of all South African residential
building plans passed and completed. Notwithstanding the high level of real estate
activity, the province has emerged as the top performing property market in the country,
recording on average 8.0% capital growth – well above the national average of 5.8% in
2016Q1. This essentially means that the province has the most expensive homes.
QUARTERLY ECONOMIC BULLETIN 2016 67