Page 17 - report P Lemoine feb 2013c
P. 17

17


               behaviour,  and  by  individually  selecting  the  indent  positions  on  crystal  or  matrix

               regions,  one  deliberately  avoid  interfaces.  Hence  the  randomly  positioned
               measurements,  in  the  whole,  test  more  interfaces,  hence  display  the  largest

               differences.

                              Y asrec crystal                             Y fired crystal

                    4.5                                        4.5
                     4                                          4
                    3.5 3                                      3.5 3
                   Frequency  2.5 2                           Frequency  2.5 2


                    1.5
                     1                                         1.5 1
                    0.5                                        0.5
                     0                                          0
                      80  84  88  92  96  100  104  108  112  116  120  80  84  88  92  96  100  104  108  112  116  120

                                     E, Gpa                                     E, Gpa


                               Y N2 crystal                               Y acid crystal

                    4.5                                        4.5
                     4                                          4
                    3.5 3                                      3.5 3
                   Frequency  2.5 2                          Frequency  2.5 2

                    1.5
                     1                                         1.5 1
                    0.5                                        0.5
                     0                                          0
                      80  84  88  92  96  100  104  108  112  116  120  80  84  88  92  96  100  104  108  112  116  120
                                     E, Gpa                                     E, Gpa


                                                  no Y asrec crystal

                                         4.5
                                          4
                                         3.5 3
                                        Frequency  2.5 2

                                         1.5
                                          1
                                         0.5
                                          0
                                           80  84  88  92  96  100  104  108  112  116  120
                                                          E, Gpa

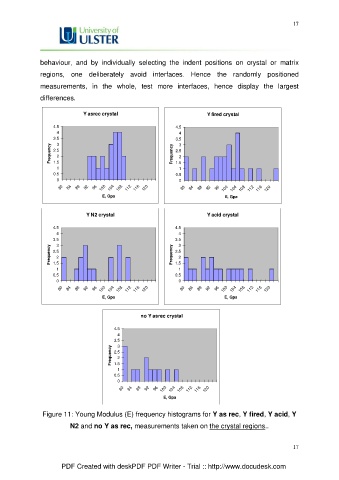
                Figure 11: Young Modulus (E) frequency histograms for Y as rec, Y fired, Y acid, Y

                          N2 and no Y as rec, measurements taken on the crystal regions..


                                                                                                        17


                       PDF Created with deskPDF PDF Writer - Trial :: http://www.docudesk.com
   12   13   14   15   16   17   18   19   20   21   22