Page 22 - report P Lemoine feb 2013c
P. 22

22


                                                       matrix region

                                   30

                                   25

                                   20
                                  E, GPa  15


                                   10

                                    5

                                    0
                                         Y asrec   Y fired    Y N2      Y acid  no Y asrec


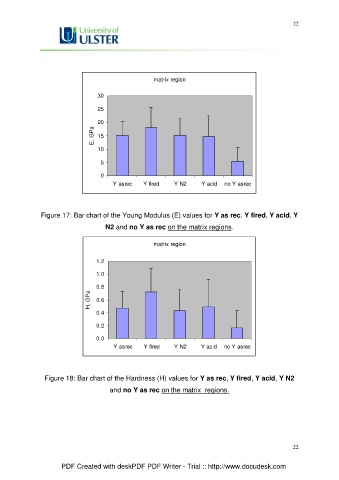
               Figure 17: Bar chart of the Young Modulus (E) values for Y as rec, Y fired, Y acid, Y
                                      N2 and no Y as rec on the matrix regions.


                                                       matrix region


                                   1.2

                                   1.0
                                   0.8
                                H, GPa  0.6


                                   0.4

                                   0.2

                                   0.0
                                         Y asrec   Y fired    Y N2      Y acid  no Y asrec


                 Figure 18: Bar chart of the Hardness (H) values for Y as rec, Y fired, Y acid, Y N2

                                        and no Y as rec on the matrix  regions.


                                                                                                        22


                       PDF Created with deskPDF PDF Writer - Trial :: http://www.docudesk.com
   17   18   19   20   21   22   23   24   25   26   27