
Page 23 - report P Lemoine feb 2013c
P. 23
23
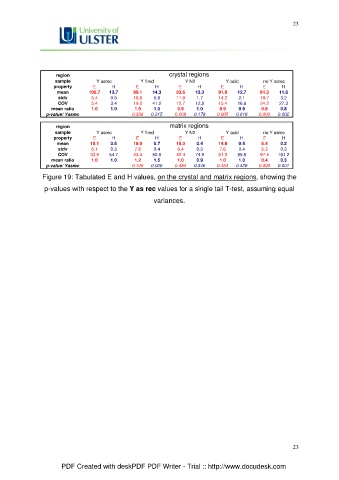
region crystal regions
sample Y asrec Y fired Y N2 Y acid no Y asrec
property E H E H E H E H E H
mean 100.7 13.7 99.1 14.3 93.6 13.3 91.9 12.7 81.3 11.6
stdv 5.4 0.5 18.8 5.9 11.9 1.7 14.2 2.1 19.7 3.2
COV 5.4 3.4 19.0 41.2 12.7 12.8 15.4 16.6 24.2 27.3
mean ratio 1.0 1.0 1.0 1.0 0.9 1.0 0.9 0.9 0.8 0.8
p-value/ Yasrec 0.336 0.315 0.009 0.179 0.005 0.016 0.000 0.002
region matrix regions
sample Y asrec Y fired Y N2 Y acid no Y asrec
property E H E H E H E H E H
mean 15.1 0.5 18.0 0.7 15.0 0.4 14.8 0.5 5.4 0.2
stdv 5.1 0.3 7.8 0.4 6.4 0.3 7.6 0.4 5.3 0.3
COV 33.9 54.7 43.4 50.0 42.4 74.9 51.0 85.6 97.4 161.2
mean ratio 1.0 1.0 1.2 1.5 1.0 0.9 1.0 1.0 0.4 0.3
p-value/ Yasrec 0.105 0.005 0.484 0.346 0.454 0.429 0.000 0.001
Figure 19: Tabulated E and H values, on the crystal and matrix regions, showing the
p-values with respect to the Y as rec values for a single tail T-test, assuming equal
variances.
23
PDF Created with deskPDF PDF Writer - Trial :: http://www.docudesk.com