Page 30 - report P Lemoine feb 2013c
P. 30

30


                                                        Microscope objective


                                         Indenter
                                           head


                                                                                           .
                                                                    Sample stage
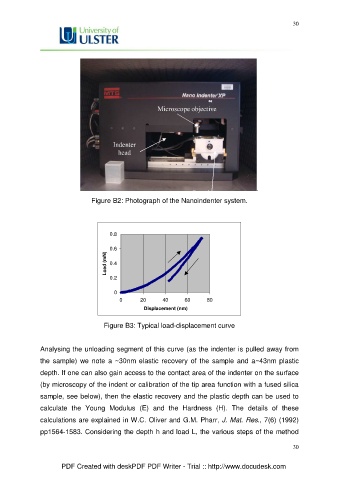
                                 Figure B2: Photograph of the Nanoindenter system.


                                        0.8

                                        0.6
                                      Load (mN)  0.4


                                        0.2


                                         0
                                           0      20      40      60      80
                                                    Displacement (nm)


                                     Figure B3: Typical load-displacement curve


               Analysing the unloading segment of this curve (as the indenter is pulled away from
               the  sample)  we  note  a  ~30nm  elastic  recovery  of  the  sample  and  a~43nm  plastic

               depth. If one can also gain access to the contact area of the indenter on the surface

               (by microscopy of the indent or calibration of the tip area function with a fused silica
               sample, see below), then the elastic recovery and the plastic depth can be used to

               calculate  the  Young  Modulus  (E)  and  the  Hardness  (H).  The  details  of  these

               calculations are explained in W.C. Oliver and G.M. Pharr, J. Mat. Res., 7(6) (1992)
               pp1564-1583. Considering the depth h and load L, the various steps of the method


                                                                                                        30


                       PDF Created with deskPDF PDF Writer - Trial :: http://www.docudesk.com
   25   26   27   28   29   30   31   32   33