Page 31 - report P Lemoine feb 2013c
P. 31

31


               are;


                   · Determination  of  the  contact  depth  h c  (h c=h-eL/S)  from  h  and  L  and  S;  the
                      stiffness measured as the slope of the unloading curve at depth h.


                                                                                     2
                                                                                                   1/2
                   · Determination of the projected contact area A (A= 24.5h c  + a 1h c+a 2h c +..),

                      where  the  coefficient  a i  are  determination  form  a  calibration  experiment  on
                      fused silica.


                   · Determination of the hardness H=L/A


                                                                          1/2
                   · Determination of the reduced modulus E*=S/(2A )


                                                                         2
                                                                                   2

                   · Determination of the E value from (1/E*)=(1-n t )/E t+(1-n)/E, where n t and E t
                      are  the  Poisson  ratio  and  Young  modulus  of  the  tip  and  n  and  E  are  the
                      Poisson ratio and Young modulus of the sample.


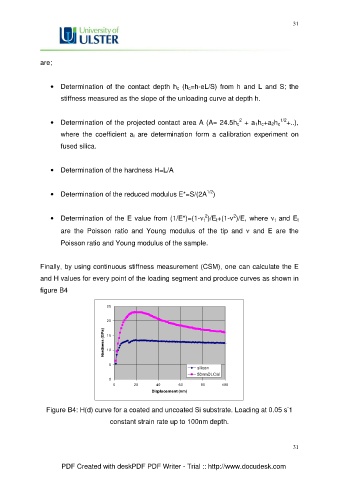
               Finally, by using continuous stiffness measurement (CSM), one can calculate the E
               and H values for every point of the loading segment and produce curves as shown in

               figure B4


                                       25

                                       20
                                     Hardness (GPa)  15


                                       10


                                       5
                                                                      silicon
                                                                      50nmDLC/si
                                       0
                                         0      20      40      60      80     100
                                                      Displacement (nm)

                                                                                                      -
                 Figure B4: H(d) curve for a coated and uncoated Si substrate. Loading at 0.05 s 1
                                        constant strain rate up to 100nm depth.


                                                                                                        31


                       PDF Created with deskPDF PDF Writer - Trial :: http://www.docudesk.com
   26   27   28   29   30   31   32   33