
Page 11 - ESG Monograph 34-1 (Final)_Neat
P. 11
perceptions of being an opinion leader (scale range of 3- the number of schools where they had provided services
48; Cronbach alpha = 0.82). For professional practice, that school year was 3.9 (SD = 8.2). In regard to sex, race,
there were two sub-scales: (a) providing HPV vaccine level of nursing certification, and type of school employed,
resources and information to parents and students, and (b) the sample was homogenous (see Table 1 for additional
school district support for school nurses providing health demographic characteristics).
education. The sub-scale measuring school nurses’ practice
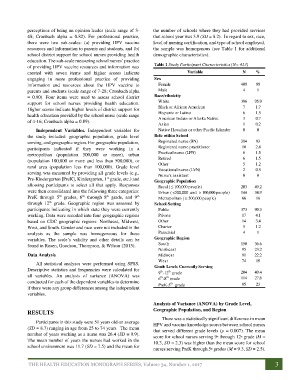
of providing HPV vaccine resources and information was Table 1 Study Participant Characteristics (N= 413)
created with seven items and higher scores indicate Variable N %
engaging in more professional practice of providing Sex
information and resources about the HPV vaccine to Female 409 99
parents and students (scale range of 7-28; Cronbach alpha Male 4 1
= 0.90). Four items were used to assess school district Race/ethnicity
support for school nurses providing health education. White 396 95.9
Higher scores indicate higher levels of district support for Black or African American 7 1.7
health education provided by the school nurse (scale range Hispanic or Latino 6 1.5
of 4-16; Cronbach alpha = 0.89). American Indian or Alaska Native 3 0.7
Asian 1 0.2
Independent Variables. Independent variables for Native Hawaiian or other Pacific Islander 0 0
the study included: geographic population, grade level Role within School
serving, and geographic region. For geographic population, Registered nurse (RN) 384 93
participants indicated if they were working in a Registered nurse practitioner 10 2.4
metropolitan (population 500,000 or more), urban Practical nurse (LPN) 6 1.5
(population 100,000 or more and less than 500,000), or Retired 6 1.5
rural area (population less than 100,000). Grade level Other 5 2 1.2
Vocational nurse (LVN)
0.5
serving was measured by providing all grade levels (e.g., Nurse's assistant 0 0
Pre-Kindergarten [PreK], Kindergarten, 1 grade, etc.) and Geographic Population
st
allowing participants to select all that apply. Responses Rural ( ≤ 100,000 people) 203 49.2
were then consolidated into the following three categories: Urban ( <500,000 and > 100,000 people) 144 34.9
PreK through 5 grades, 6 through 8 grade, and 9 Metropolitan ( ≥ 500,000 people) 66 16
th
th
th
th
th
through 12 grade. Geographic region was assessed by School Setting
participants indicating in which state they were currently Public 373 90.3
working. Data were recoded into four geographic regions Private 17 4.1
based on CDC geographic regions: Northeast, Midwest, Other 14 3.4
West, and South. Gender and race were not included in the Charter 5 1.2
analysis as the sample was homogeneous for these Parochial 4 1
variables. The scale’s validity and other details can be Geographic Region
found in Rosen, Goodson, Thompson, & Wilson (2015). South 150 36.6
Northeast 95 23.2
Data Analysis Midwest 91 22.2
West 74 18
All statistical analyses were performed using SPSS.
Descriptive statistics and frequencies were calculated for Grade Levels Currently Serving 204 49.4
th
th
all variables. An analysis of variance (ANOVA) was 9 -12 grade 114 27.6
th
th
6 -8 grade
conducted for each of the dependent variables to determine th 95 23
if there were any group differences among the independent PreK-5 grade
variables.
Analysis of Variance (ANOVA) by Grade Level,
Geographic Population, and Region
RESULTS
There was a statistically significant difference in mean
Participants in this study were 51 years old on average HPV and vaccine knowledge scores between school nurses
(SD = 8.7) ranging in age from 25 to 74 years. The mean that served different grade levels (p = 0.007). The mean
number of years working as a nurse was 26.4 (SD = 9.9). score for school nurses serving 9 through 12 grade (M =
th
th
The mean number of years the nurses had worked in the 10.3, SD = 2.3) was higher than the mean score for school
school environment was 11.7 (SD = 7.5) and the mean for
nurses serving PreK through 5 grades (M = 9.3, SD = 2.5).
th
THE HEALTH EDUCATION MONOGRAPH SERIES, Volume 34, Number 1, 2017 3