
Page 3 - artt
P. 3
Advances in Social Science, Education and Humanities Research, volume 176
Establishment of GM (1, 1) Model ̂ ( + 1) = ̂ ( + 1) − ̂ ();
(1)
(0)
(1)
Do the adjacent data column processing for (1) (): Model error and accuracy test
1 The error level of the model is mainly reflected by
(1) () = [ (1) () + (1) ( − 1)] (0)
2 residual and relative error ∆. Its calculation formula is:
Generate B and constant item vector Y: (0) (0) ̂ (0)
() = () − (0) () , ∆= (∆ ) = (| (t)/
− (1) () 1 (0) () (0) (t)|) (t = 1,2,3,……, n)
B = [ … …] Y = [ … ] The test used for model accuracy is the average relative
− (1) ( + 1) 1 (0) () error ∆ ̅ . The formula is:
Solving Gray Parameter ̂ with Least Square ∆ ̅ = ∑ ∆ , (t = 1, 2,3,……, n)
1
Method,then̂ = [, ] = ( ) ; =1
−1
The test standard of model accuracy is: when ∆ ̅ ≤ 0.10, the
Establish a first-order linear differential equation for precision reaches one level; when 0.01 ≤ ∆ ̅ ≤ 0.05 , the
(1) ()for (1) (), (1) + (1) = , among them, t is the time precision reaches two; when 0.05 ≤ ∆ ̅ ≤ 0.10, the precision
parameter, a, u is the undetermined coefficient, respectively reaches three; when 0.10 ≤ ∆ ̅ ≤ 0.20,the accuracy reaches
called the development coefficient and the gray action quantity, four. Levels below 4 do not meet the standard.
the valid interval of a is (-2, 2), and the matrix composed of a
and u is ̂ = [, ] . C. Data Sources
The data used in this paper are from the 2009-2016 annual
(1)
Substituting the gray parameter ̂ into + (1) = report of the Huangshan District Government Information
(1) Disclosure, in which the per capita disposable income of
and solving for + (1) = gives the time farmers (yuan) in the Huangshan District government statistics
corresponding function of the model: (1) ( + 1) = [ (0) (1) − before 2013 is the per capita net income of farmers (yuan)
records The statistical yearbook after 2014 uses per capita
−
] + , among them, e is a common logarithm. Since ̂ disposable income (yuan).
is an approximate value obtained by a least-squares method, III. EMPIRICAL ANALYSIS RESULTS
(1)
̂ ( + 1) is an approximate expression.
A. Analysis of the Gray Relational Degree of Tourism
The calculation of the analog value of the original Income in Huangshan City
sequence
Data Processing and Gray Relational Analysis:
(1)
(1)
The function expressions ̂ ( + 1) and ̂ () are
discretized, and the difference between the two is done in order This article adopts 8 factors.
to restore the original array of (0) () to obtain the
approximate data sequence.ie:
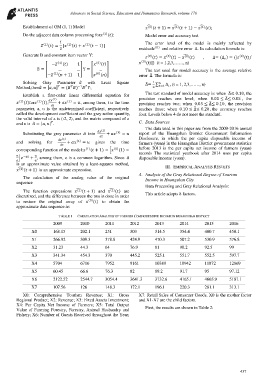
TABLE I CORRELATION ANALYSIS OF TOURISM COMPREHENSIVE INCOME IN HUANGSHAN DISTRICT
2009 2010 2011 2012 2013 2014 2015 2016
X0 168.15 202.1 251 303 314.5 354.4 400.7 450.1
X1 266.92 309.3 378.8 424.9 470.3 507.2 530.9 576.8
X2 31.23 44.3 64 76.9 81 90.2 92.5 99
X3 341.34 454.3 370 445.2 525.1 551.7 552.5 597.7
X4 5704 6716 7952 9161 10389 10942 11872 12869
X5 60.45 66.6 76.3 82 89.2 91.7 95 97.12
X6 2122.52 2544.7 3054.4 3641.3 3732.6 4165.1 4665.9 5187.1
X7 107.56 126 148.3 172.1 196.1 220.3 281.1 313.1
X0: Comprehensive Tourism Revenue; X1: Gross X7: Retail Sales of Consumer Goods. X0 is the mother factor
Regional Product; X2: Revenue; X3: Fixed Assets Investment; and X1-X7 are the child factors.
X4: Per Capita Net Income of Farmers; X5: Total Output
Value of Farming Forestry, Forestry, Animal Husbandry and First, the results are shown in Table 2:
Fishery; X6: Number of Guests Received throughout the Year;
437