
Page 4 - SIAA Annual Report 2015 Continuous
P. 4
201520112008 327 Premium Volume: All Companies (2010-20154)35
2012
2009 437 2013 $6.05B 455
4162B
2010 ANNUAL R4E20PORT2014 $5.70B
412 2015 $4.89B 4051B
2012 435 $E4.x2is4tBing
2013 455 Start-Up 4B
$3.43B
2014 412 $3.01B
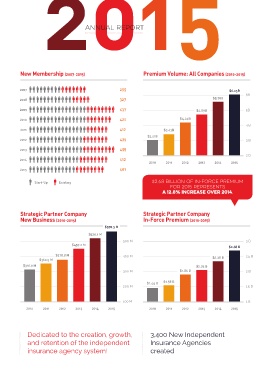
2N01e5w Membership (2007-2015) 3B
401 Premium Volume: All Companies (2010-2015)
2007 Start-Up Existing 2B
295 2010 2011 2012 2013 2014 $260.0155B 6B
2008 327 $5.70B
2P00r9emium Volume: All Companies (2010-20154)37 Strategic Partner Company $570.3 M 5B
New Business (2010-2015$)4.89B
2010 420 4B
$4.24B 500 M
3B
2011 $6.05B 412 $3.43B $526.1 M
$457.2 M
6B $3.01B
$5.70B
2012 435
2013 $4.89B 4555B $378.8 M 400 M
$360.5 M 2B
2014 412 300 M
$4.24B $316.9 M
2015 4B 2010
$3.01B 2011 2012 2013 2014 2015
401
$3.43B
3B
Strategic Partner Company 200 M
Start-Up Existing New$2B.6u8siBnielslsio(2n010o-2f01I5n) -Force Premium
for 2015 represents $570.3 M
2B a 12.8% increase over 2014.
$526.1 M 100 M
2010 2011 2012 2013 2014 2015 2010 2011 2012 2013 2014 2015
500 M
Premium Volume: All Companies (2010-2015) $457.2 M
Strategic Partner Company SInt-rFaotergcei$c3P6P0r.a5eMrmtn$i3eu7rm8.8CM(o2m010p-2a0n15y) 400 M
New Business (2010-2015) $6.05B
$5.70B $570.3 M 6B $316.9 M
$526.1 M 300 M
$4.89B 5B00 M $2.68 B 3B
$457.2 M 40B0 M 200 M
30B0 M
$4.24B $2.38 B 2.5 B
$378.8 M
$$336.04.35BM 100 M
2B
$$3316.0.91BM $2.05 B
2010 2011 $12.08162B 2013 2014 2015
20B0 M St$r1.a44teBgic$1P.58aBrtner Company 1.5 B
In-Force Premium (2010-2015)
2010 2011 2012 2013 2014 2015
100 M 1B
Str2a01t0egic2P01a1 rtne2r012Comp20a13ny 2014 2015 2010 2011 2012 2013 2014 2015
New Business (2010-2015) 3B
$570.3 M $2.68 B
Strategic Partner Company 2.5 B
2B
In-Force Premium (2010-2015) $526.1 M $2.38 B 1.5 B
Dedicated to the creation, grow5t00hM,
and retention o$4f57t.2hMe independent 3,400 New Inde$2p.05eBndent
Insurance$1A.86gBencies
insu$r3a60n.5 cM e$3a78g.8 Mency system! B 340B0 M $1.c44rBea$t1e.58dB
$2.68 23.050BM
$316.9 M
$2.38 B
$2.05 B 1B
$1.86 B