Page 38 - The Impact of the 2018 Trade War on U.S. Prices and Welfare
P. 38

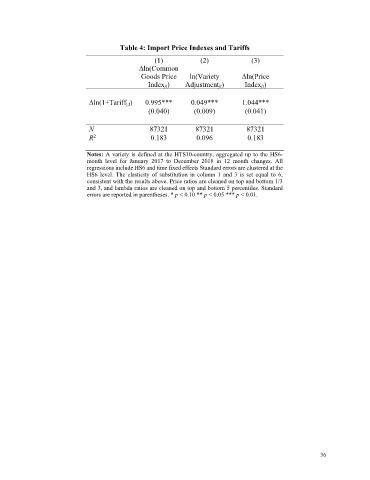
Table 4: Import Price Indexes and Tariffs

                                                    (1)            (2)              (3)
                                               ∆ln(Common
                                                Goods Price     ln(Variety       ∆ln(Price
                                                  Indexjt)    Adjustmentjt)       Indexjt)

                              ∆ln(1+Tariffj,t)   0.995***       0.049***         1.044***
                                                  (0.040)        (0.009)          (0.041)

                              N                    87321          87321            87321
                              R 2                  0.183          0.096            0.183

                              Notes: A variety is defined at the HTS10-country, aggregated up to the HS6-
                              month  level  for  January  2017  to  December  2018  in  12  month  changes.  All
                              regressions include HS6 and time fixed effects Standard errors are clustered at the
                              HS6  level.  The  elasticity  of  substitution  in  column  1  and  3  is  set  equal  to  6,
                              consistent with the results above. Price ratios are cleaned on top and bottom 1/3
                              and 3, and lambda ratios are cleaned on top and bottom 5 percentiles. Standard
                              errors are reported in parentheses. * p < 0.10 ** p < 0.05 *** p < 0.01.


                                                                                                           36
   33   34   35   36   37   38   39   40