
Page 19 - February 2018 DDS Newsletter The Scoop
P. 19
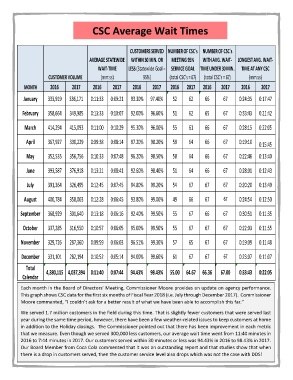
CSC Average Wait Times

                                    CUSTOMERS SERVED NUMBER OF CSC's NUMBER OF CSC's

                           AVERAGE STATEWIDE WITHIN 30MIN. OR MEETING 95% WITH AVG. WAIT- LONGEST AVG. WAIT-

                           WAIT-TIME LESS (Statewide Goal = SERVICE GOAL TIME UNDER 30MIN. TIME AT ANY CSC

          CUSTOMER VOLUME  (mm:ss)  95%) (total CSC's = 67) (total CSC's = 67) (mm:ss)
          2016 2017
MONTH                      2016 2017 2016 2017 2016 2017 2016 2017 2016 2017
January
          333,919 336,171 0:11:33 0:09:21 93.30% 97.40% 52 62 66 67 0:24:35 0:17:47

February 358,664 349,985 0:13:33 0:10:07 92.00% 96.60% 51 62 65 67 0:33:43 0:21:42

March 414,294 415,093 0:11:00 0:10:29 95.30% 96.00% 55 61 66 67 0:28:15 0:22:05

April 367,927 330,229 0:09:38 0:08:14 97.20% 98.20% 59 64 66 67 0:19:10 0:15:45
May 352,535 356,756 0:10:33 0:07:48 96.20% 98.50% 58 64 66 67 0:22:46 0:13:40

June 393,587 376,918 0:13:21 0:08:41 92.60% 98.40% 51 64 66 67 0:28:01 0:12:43

July 391,364 326,495 0:12:45 0:07:45 94.80% 99.20% 54 67 67 67 0:20:20 0:13:49

August 400,784 358,003 0:12:28 0:06:45 93.80% 99.00% 49 66 67 67 0:24:54 0:12:50

September 368,929 301,640 0:13:18 0:06:16 92.40% 99.50% 55 67 66 67 0:30:51 0:11:35

October 337,285 316,550 0:10:57 0:06:05 95.00% 99.50% 55 67 67 67 0:22:03 0:11:55

November 329,726 287,360 0:09:59 0:06:03 96.51% 99.30% 57 65 67 67 0:19:09 0:11:48

December 331,101 282,194 0:10:52 0:05:14 94.00% 99.60% 61 67 67 67 0:23:07 0:11:07

 Total    4,380,115 4,037,394 0:11:40 0:07:44 94.43% 98.43% 55.00 64.67 66.36  67.00  0:33:43 0:22:05
Calendar

Each month in the Board of Directors’ Meeting, Commissioner Moore provides an update on agency performance.
This graph shows CSC data for the first six months of Fiscal Year 2018 (i.e. July through December 2017). Commissioner
Moore commented, “I couldn’t ask for a better result of what we have been able to accomplish this far.”

We served 1.7 million customers in the field during this time. That is slightly fewer customers that were served last
year during the same time period, however, there have been a few weather-related issues to keep customers at home
in addition to the Holiday closings. The Commissioner pointed out that there has been improvement in each metric
that we measure. Even though we served 300,000 less customers, our average wait time went from 11:40 minutes in
2016 to 7:44 minutes in 2017. Our customers served within 30 minutes or less was 94.43% in 2016 to 98.43% in 2017.
Our Board Member from Coca Cola commented that it was an outstanding report and that studies show that when
there is a drop in customers served, then the customer service level also drops which was not the case with DDS!