
Page 39 - World Airnews February Magazine Edition 2021
P. 39
FEATURE
the top 10 airlines compared to last
year.
Out went Eurowings, massively
downsized by parent Lufthansa
Group in April, which moves to 14th
place, -69% year-on-year and Nor-
wegian Air Shuttle, which continues
to struggle despite entering bank-
ruptcy protection in Norway and
Ireland, dropping -73% and moving
to 16th.
Their places were taken by Wizz Air,
climbing from 12th to 9th following
a rapid restart of operations in May
and a major base expansion strategy;
and Pegasus Airlines, up from 14th to
10th on the back of strong domestic
demand in Turkey - which also was
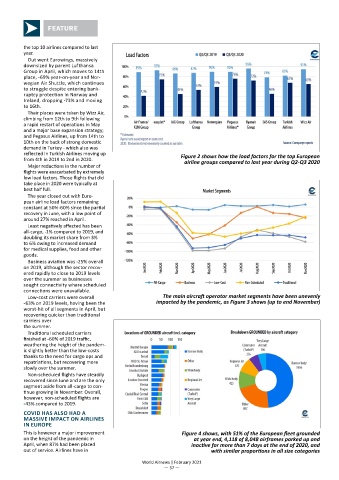
reflected in Turkish Airlines moving up Figure 2 shows how the load factors for the top European
from 4th in 2019 to 2nd in 2020. airline groups compared to last year during Q2-Q3 2020
Major reductions in the number of
flights were exacerbated by extremely
low load factors. Those flights that did
take place in 2020 were typically at
best half full.
The year closed out with Euro-
pean airline load factors remaining
constant at 50%-60% since the partial
recovery in June, with a low point of
around 27% reached in April.
Least negatively affected has been
all-cargo, -1% compared to 2019, and
doubling its market share from 3%
to 6% owing to increased demand
for medical supplies, food and other
goods.
Business aviation was -25% overall
on 2019, although the sector recov-
ered rapidly to close to 2019 levels
over the summer as businesses
sought connectivity where scheduled
connections were unavailable.
Low-cost carriers were overall The main aircraft operator market segments have been unevenly
-63% on 2019 levels, having been the impacted by the pandemic, as Figure 3 shows (up to end November)
worst-hit of all segments in April, but
recovering quicker than traditional
carriers over
the summer.
Traditional scheduled carriers
finished at -60% of 2019 traffic,
weathering the height of the pandem-
ic slightly better than the low-costs
thanks to the need for cargo ops and
repatriations, but recovering more
slowly over the summer.
Non-scheduled flights have steadily
recovered since June and are the only
segment aside from all-cargo to con-
tinue growing in November. Overall,
however, non-scheduled flights are
-43% compared to 2019.
COVID HAS ALSO HAD A
MASSIVE IMPACT ON AIRLINES
IN EUROPE
This is however a major improvement Figure 4 shows, with 51% of the European fleet grounded
on the height of the pandemic in at year end, 4,118 of 8,048 airframes parked up and
April, when 87% had been placed inactive for more than 7 days at the end of 2020, and
out of service. Airlines have in with similar proportions in all size categories
World Airnews | February 2021
— 37 —