
Page 42 - World Airnews February Magazine Edition 2021
P. 42
FEATURE
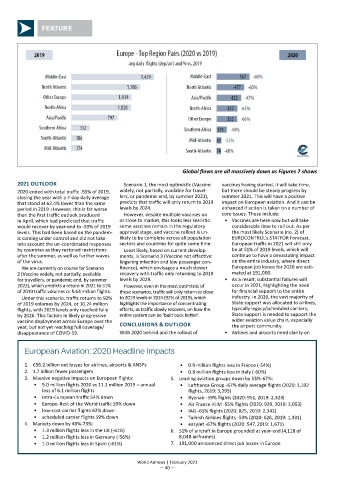
Global flows are all massively down as Figures 7 shows
2021 OUTLOOK Scenario 1, the most optimistic (Vaccine vaccines having started, it will take time,
2020 ended with total traffic -55% of 2019, widely, not partially, available for travel- but there should be steady progress by
closing the year with a 7-day daily average lers, or pandemic end, by summer 2021), summer 2021. This will have a positive
that stood at 62.4% lower than the same predicts that traffic will only return to 2019 impact on European aviation. And it can be
period in 2019. However, this is far worse levels by 2024. enhanced if action is taken on a number of
than the first traffic outlook produced However, despite multiple vaccines on core issues. These include:
in April, which had predicted that traffic or close to market, this looks less realistic: • Vaccines are here now but will take
would recover by year-end to -20% of 2019 some vaccines remain in the regulatory considerable time to roll out. As per
levels. This had been based on the pandem- approval stage, and vaccine rollout is un- the most likely Scenario (no. 2) of
ic coming under control and did not take likely to be complete across all population EUROCONTROL’s STATFOR Forecast,
into account the un-coordinated responses sectors and countries for quite some time. European traffic in 2021 will still only
by countries as they restored restrictions Least likely, based on current develop- be at 51% of 2019 levels, which will
after the summer, as well as further waves ments, is Scenario 3 (Vaccine not effective: continue to have a devastating impact
of the virus. lingering infection and low passenger con- on the entire industry, where direct
We are currently on course for Scenario fidence), which envisages a much slower European job losses for 2020 are esti-
2 (Vaccine widely, not partially, available recovery with traffic only returning to 2019 mated at 191,000.
for travellers, or pandemic end, by summer levels by 2029. • As a result, substantial failures will
2022), which predicts a return in 2021 to 51% However, even in the most optimistic of occur in 2021, highlighting the need
of 2019 traffic volumes or 5.64 million flights. these scenarios, traffic will only return to close for financial support to the entire
Under this scenario, traffic returns to 92% to 2019 levels in 2024 (92% of 2019), which industry. In 2020, the vast majority of
of 2019 volumes by 2024, or 10.24 million highlights the importance of concentrating State support was allocated to airlines,
flights, with 2019 levels only reached fully efforts, as traffic slowly recovers, on how the typically legacy/scheduled carriers;
by 2026. This factors in likely progressive entire system can be ‘built back better’. State support is needed to support the
vaccine deployment across Europe over the wider aviation value chain, especially
year, but not yet reaching full coverage/ CONCLUSIONS & OUTLOOK the airport community.
disappearance of COVID-19. With 2020 behind and the rollout of • Airlines and airports need clarity on
European Aviation: 2020 Headline Impacts
1. €56.2 billion net losses for airlines, airports & ANSPs • 0.9 million flights less in France (-54%)
2. 1.7 billion fewer passengers • 0.8 million flights less in Italy (-60%)
3. Massive negative impacts on European flights: 5. Leading aviation groups down by 53%-67%:
• 5.0 million flights 2020 vs 11.1 million 2019 = annual • Lufthansa Group -67% daily average flights (2020: 1,102
loss of 6.1 million flights flights, 2019: 3,295)
• intra-European traffic 54% down • Ryanair -59% flights (2020: 951, 2019: 2,323)
• Europe-Rest of the World traffic 59% down • Air France-KLM -55% flights (2020: 920, 2019: 2,053)
• low-cost carrier flights 62% down • IAG -65% flights (2020: 825, 2019: 2,342)
• scheduled carrier flights 59% down • Turkish Airlines flights -53% (2020: 626, 2019: 1,331)
4. Markets down by 40%-73%: • easyJet -67% flights (2020: 547, 2019: 1,671)
• 1.3 million flights less in the UK (-61%) 6. 51% of aircraft in Europe grounded at year-end (4,118 of
• 1.2 million flights less in Germany (-56%) 8,048 airframes)
• 1.0 million flights less in Spain (-61%) 7. 191,000 announced direct job losses in Europe
World Airnews | February 2021
— 40 —