
Page 13 - 2019 Annual Report Final PDF_Neat
P. 13
state of Minnesota every year with a long-standing history to test new corn varie es. More informa on can be found
The UMN Agronomy and Soil Science Department plants and harvests an elite replicated corn trial throughout the
Soybeans
Hazelnuts
gene c cul vars of hazelnuts. One acre trial is a nitrogen rate trial related to the previously
See page 45 for more This plot was established fall of 2017. There were three trials established. One was a variety trial that compares lodging, yield, and plant characteris cs. The second was a nitrogen rate trial. The third was a comparison of kernza produc on to tradi onal farming . During cropping season 2019, corn was the tradi onal crop in comparison. The goal of this project is to look at this new crop and examine its poten al for this area in yield, produc on, and marke ng. Due to the fact that this crop is a perennial, carbon footprint of cereal grains is also bei
UMN Elite Corn Trial at this link: h ps://www.maes.umn.edu/publica ons/field-crop-trials/2019trials UMN Hazelnuts Lois Braun, University of Minnesota hazelnut researcher, established hazelnuts at the Ag Center in 2000. This project is currently focusing on nitrogen management in different 226.18 227.19 220.48 231.01 198.90 230.65 235.33 238.01 224.74 234.48 established trials with cul vars that are more suited to the region. informa on. UMN Kernza 1091 1184 1167 1166 1157 1174 1185 1166 1143 1179 6660 7260 7375 7455 6305 7400 7650 7740 6985 7555 Kernza UMN and RDO Potatoes 52
1170
21.7
Normal Rate + 50
50.3
233.48
7580
7680
Normal Rate + 50
240.06
51.7
1150
21.9
20.2
1123
52.9
182.01
Normal Rate - 50 + NZONE MAX
5565
20.3
6275
50.4
Normal Rate - 50 + NZONE MAX
1161
198.27
Normal Rate - 50 + NZONE MAX
216.89
50.8
6985
1174
20.8
NA
NA
Normal Rate - 50 + NZONE MAX
NA
NA
NA
19.3
Normal Rate - 50
52.0
1070
203.94
5875
51.6
19.9
Normal Rate - 50
6405
1166
202.52
Normal Rate - 50
7155
22.1
1166
220.02
51.8
22.4
223.15
1166
Normal Rate - 50
48.9
7285
218.99
19.9
50.7
6635
Normal Rate
1117
Normal Rate
1167
226.41
51.7
21.2
7285
7460
51.8
1164.6
21.6
231.15
Normal Rate
Normal Rate
7580
1155
237.73
51.9
21.3
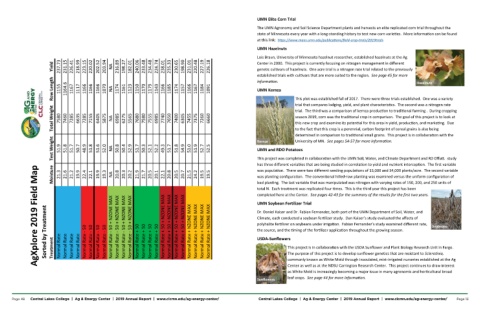
Yield
Treatment
Moisture Test Weight Total Weight Row Length
Sorted by Treatment
AgXplore 2019 Field Map
Page 48 Central Lakes College | Ag & Energy Center | 2019 Annual Report | www.clcmn.edu/ag-energy-center/