
Page 14 - 2019 Annual Report Final PDF_Neat
P. 14
1123
182.01
20.2
5565
52.9
54.9
6305
198.90
1157
20.7
1070
52.0
5875
203.94
19.3
52.5
1091
226.18
19.5
6660
6635
1117
19.9
218.99
50.7
20.1
6985
52.2
224.74
1143
1161
20.3
198.27
6275
50.4
51.8
20.5
230.65
1174
7400
51.6
6405
19.9
1166
202.52
19.5
227.19
7260
1184
52.7
51.7
21.2
1167
7285
226.41
52.1
234.48
7555
20.5
1179
216.89
1174
6985
20.8
50.8
1185
7650
51.7
20.8
235.33
51.8
22.1
220.02
7155
1166
1167
220.48
51.9
7375
24.2
21.6
1164.6
231.15
51.8
7460
21.7
50.3
1170
7580
233.48
NA
NA
NA
NA
NA
22.1
7740
1166
238.01
49.3
48.9
7285
223.15
1166
22.4
21.5
1166
7455
231.01
53.0
51.9
237.73
21.3
7580
1155
240.06
21.9
1150
51.7
7680
Moisture Test Weight
Yield
Total Weight Row Length
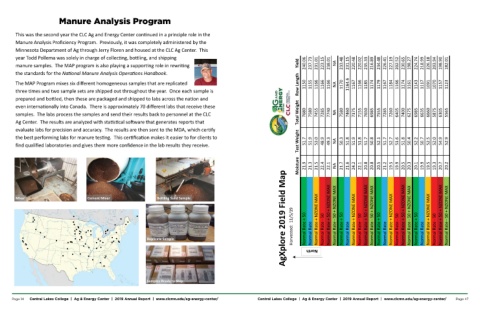
the best performing labs for manure tes ng. This cer fica on makes it easier to for clients to
evaluate labs for precision and accuracy. The results are then sent to the MDA, which cer fy
even interna onally into Canada. There is approximately 70 different labs that receive these
three mes and two sample sets are shipped out throughout the year. Once each sample is
samples. The labs process the samples and send their results back to personnel at the CLC
find qualified laboratories and gives them more confidence in the lab results they receive.
This was the second year the CLC Ag and Energy Center con nued in a principle role in the
prepared and bo led, then these are packaged and shipped to labs across the na on and
Minnesota Department of Ag through Jerry Floren and housed at the CLC Ag Center. This
Manure Analysis Proficiency Program. Previously, it was completely administered by the
Ag Center. The results are analyzed with sta s cal so ware that generates reports that
Manure Analysis Program
Bo ling Solid Sample Replicate Sample Normal Rate - 50 + NZONE MAX Normal Rate + 50 + NZONE MAX Normal Rate - 50 Normal Rate + NZONE MAX Normal Rate Normal Rate + 50 Normal Rate - 50 + NZONE MAX Normal Rate + 50 + NZONE MAX Normal Rate - 50 Normal Rate + NZONE MAX Normal Rate Normal Rate + 50 Normal Rate - 50 + NZONE MAX Normal Rate + 50 + NZONE MAX Normal Rate - 50 Normal Rate + NZONE MAX Normal Rate Normal Rate + 50 Normal Rate - 50 + NZONE MAX Normal Rate + 50 + NZONE MAX Normal Rate - 50 Normal Ra
manure samples. The MAP program is also playing a suppor ng role in rewri ng
The MAP Program mixes six different homogeneous samples that are replicated
year Todd Pollema was solely in charge of collec ng, bo ling, and shipping
Manure Analysis Program
the standards for the Na onal Manure Analysis Opera ons Handbook.
Cement Mixer Central Lakes College | Ag & Energy Center | 2019 Annual Report | www.clcmn.edu/ag-energy-center/
Mixer Page 14