
Page 62 - HBR's 10 Must Reads 20180 - The Definitive Management Ideas of the Year from Harvard Business Review
P. 62
VISUALIZATIONS THAT REALLY WORK
This is the most complicated quadrant, because in truth it holds two
categories. Recall that we originally separated exploratory purposes
into two kinds: testing a hypothesis and mining for patterns, trends,
and anomalies. The former is focused, whereas the latter is more
flexible. The bigger and more complex the data, and the less you
know going in, the more open-ended the work.
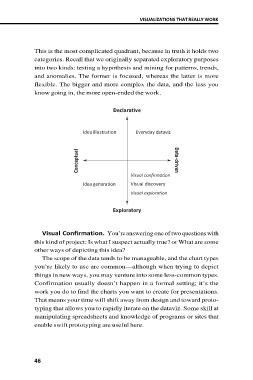
Declarative
Idea illustration Everyday dataviz
Conceptual Data-driven
Visual confirmation
Idea generation Visual discovery
Visual exploration
Exploratory
Visual Confirmation. You’re answering one of two questions with
this kind of project: Is what I suspect actually true? or What are some
other ways of depicting this idea?
The scope of the data tends to be manageable, and the chart types
you’re likely to use are common—although when trying to depict
things in new ways, you may venture into some less-common types.
Confirmation usually doesn’t happen in a formal setting; it’s the
work you do to find the charts you want to create for presentations.
That means your time will shift away from design and toward proto-
typing that allows you to rapidly iterate on the dataviz. Some skill at
manipulating spreadsheets and knowledge of programs or sites that
enable swift prototyping are useful here.
46