
Page 64 - HBR's 10 Must Reads 20180 - The Definitive Management Ideas of the Year from Harvard Business Review
P. 64
VISUALIZATIONS THAT REALLY WORK
4
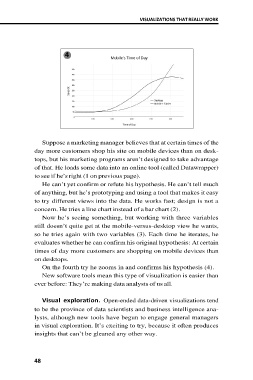
Suppose a marketing manager believes that at certain times of the
day more customers shop his site on mobile devices than on desk-
tops, but his marketing programs aren’t designed to take advantage
of that. He loads some data into an online tool (called Datawrapper)
to see if he’s right (1 on previous page).
He can’t yet confirm or refute his hypothesis. He can’t tell much
of anything, but he’s prototyping and using a tool that makes it easy
to try different views into the data. He works fast; design is not a
concern. He tries a line chart instead of a bar chart (2).
Now he’s seeing something, but working with three variables
still doesn’t quite get at the mobile-versus-desktop view he wants,
so he tries again with two variables (3). Each time he iterates, he
evaluates whether he can confirm his original hypothesis: At certain
times of day more customers are shopping on mobile devices than
on desktops.
On the fourth try he zooms in and confirms his hypothesis (4).
New software tools mean this type of visualization is easier than
ever before: They’re making data analysts of us all.
Visual exploration. Open-ended data-driven visualizations tend
to be the province of data scientists and business intelligence ana-
lysts, although new tools have begun to engage general managers
in visual exploration. It’s exciting to try, because it often produces
insights that can’t be gleaned any other way.
48