
Page 167 - eProceeding - IRSTC & RESPEX 2017
P. 167
Nur Aisah Ab.Moin / JOJAPS – JOURNAL ONLINE JARINGAN COT POLIPD
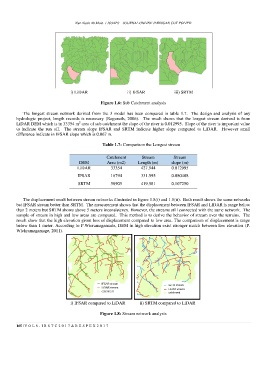
i) LiDAR ii) IFSAR iii) SRTM
Figure 1.6: Sub Catchment analysis
The longest stream network derived from the 3 model has been compared in table 1.7. The design and analysis of any
hydrologic project, length records is necessary (Ragunath, 2006). The result shows that the longest stream derived is from
2
LiDAR DEM which is in 33354 m area of sub catchment the slope of the river is 0.012995. Slope of the river is important value
to indicate the run off. The stream slope IFSAR and SRTM indicate higher slope compared to LiDAR. However small
difference indicate in IFSAR slope which is 0.067 m.
Table 1.7: Comparison the Longest stream
Catchment Stream Stream
DEM Area (m2) Length (m) slope (m)
LiDAR 33354 427.944 0.012995
IFSAR 16794 331.595 0.080408
SRTM 58905 419.581 0.107250
The displacement result between stream networks illustrated in figure 1.8(i) and 1.8(ii). Both result shows the same networks
but IFSAR stream better than SRTM. The measurement shows that the displacement between IFSAR and LIDAR is range below
than 2 meters but SRTM shows above 5 meters inconsistency. However, the streams still connected with the same network. The
sample of stream in high and low areas are compared. This method is to derive the behavior of stream over the terrains. The
result show that the high elevation given less of displacement compared to low area. The comparison of displacement is range
below than 1 meter. According to P.Wicramagamade, DEM in high elevation exist stronger match between low elevation (P.
Wickramagamage, 2011).
i) IFSAR compared to LiDAR ii) SRTM compared to LiDAR
Figure 1.8: Stream network analysis
165 | V O L 8 - I R S T C 2 0 1 7 & R E S P E X 2 0 1 7