
Page 84 - eProceeding - IRSTC & RESPEX 2017
P. 84
Che Ku Ahmad Fuad bin Che Ku Abdullah / JOJAPS – JOURNAL ONLINE JARINGAN COT POLIPD
Literature study is conducted to gain a better understanding and to get an idea of the study. This includes studies on the
equipment used, the appropriate software and work processes in this study. The topics covered are the purposes of as-built
survey, the use of TLS tools, the effectiveness of Level of Details (LOD3) and generating 3D models of as-built buildings. The
term of as-built is referring to the actual state of a built building at any time during its life cycle, particularly during its service
life (Son et al., 2015). The 3D as-built data which is acquired from field work on construction site can used to establish the
geometric properties for building façade. Currently, as-built data obtained also needed for management purposes while projects
under construction, after completion of the project, and for the operation and maintenance phase related to civil engineering. As
an example of the studies conducted, the progress of the construction activities will be compared with the 3D model 'as-built'
data obtained from the construction site along with design information contained on the building layout plan information. (Pettee,
2005).
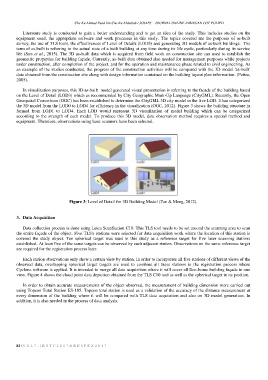
In visualization purposes, this 3D as-built model generated visual presentation is referring to the facade of the building based
on the Level of Detail (LOD3) which as recommended by City Geographic Mark-Up Language (CityGML). Recently, the Open
Geospatial Consortium (OGC) has been established to determine the CityGML 3D city model in the five LOD. It has categorized
the 3D model from the LOD0 to LOD4 for efficiency in the visualization (OGC, 2012). Figure 3 shows the building structure in
formed from LOD1 to LOD4. Each LOD would represent 3D visualization of model building which can be categorized
according to the strength of each model. To produce this 3D model, data observation method requires a special method and
equipment. Therefore, observations using laser scanners have been selected.
Figure 3: Level of Detail for 3D Building Model (Fan & Meng, 2012).
3. Data Acquisition
Data collection process is done using Leica ScanStation C10. This TLS tool needs to be set around the scanning area to scan
the entire façade of the object. Five TLS's stations were selected for data acquisition work where the location of this station is
covered the study object. Ten spherical target was used in this study as a reference target for five laser scanning stations
established. At least five of the same targets can be observed by each adjacent station. Observations on the same reference target
are required for the registration process later.
Each station observations only show a certain view by station. In order to incorporate all five stations of different views of the
observed data, overlapping spherical target targets are used to combine all these stations in the registration process where
Cyclone software is applied. It is intended to merge all data acquisition where it will cover all Eco-home building façade in one
view. Figure 4 shows the cloud point data depiction obtained from the TLS C10 tool as well as the spherical target in its position.
In order to obtain accurate measurements of the object observed, the measurement of building dimension were carried out
using Topcon Total Station ES-105. Topcon total station is used as a validation of the accuracy of the distance measurement at
every dimension of the building where it will be compared with TLS data acquisition and also on 3D model generation. In
addition, it is also needed in the process of data analysis.
82 | V O L 7 - I R S T C 2 0 1 7 & R E S P E X 2 0 1 7