
Page 71 - icripe2020
P. 71
3.0 Methodology
Research design is utilized to control the methods and approaches to use in order to congregate and assess the
details for the study (Driscoll III, T., & Petty, K. 2013). The contribution of this article is to propose a generic
framework for conducting usability tests for mobile applications through discussing research questions,
methodologies, and usability attributes. Quantitative research requires counting and measuring of events and
performing the statistical analysis of a body of numerical data. Quantitative research can be identified as the
research problem in very specific and set terms. This study is using primary data as only source for data collection.
This paper also mainly focuses on the use of Google Form as a way to replace the conventional method of
survey i.e. meeting face to face as well as to reduce filing system in the form of printout form. Google Form is a
web-based app from Google used to create forms for data collection purposes. The form is web-based and can be
shared with respondents by sending a link, emailing a message, or embedding it into a web page or blog post. There
are 30 respondents recorded from various generations and occupations. Roscoe, 1975 proposes the following
method to determine the sample size i.e. “the number of samples more than 30 and less than 500 is suitable for most
studies”. Therefore, the researchers chose to use the Roscoe method as a finding for information collection. A study
conducted by Roscoe has proven that this study can use a minimum number of samples of 30 respondents. Direct
interview also conducts to collect data for this study. There are 5 respondents had been interviewed in order to give
feedback toward this study which were tourism and hotel industry players and also customers. All the survey and
interviews conduct in Malaysia and will be analyses by the result of survey and interview
4.0 Results and Discussion
Demographic Type Percentage
Respondents (%)
Male 46.9
Gender
Female 53.1
20-30 65.62
Age 31-40 25
41-50 9.75
SPM 15.62
Diploma 31.25
Level of education Degree 31.25
Master 18.75
PHD 3.12
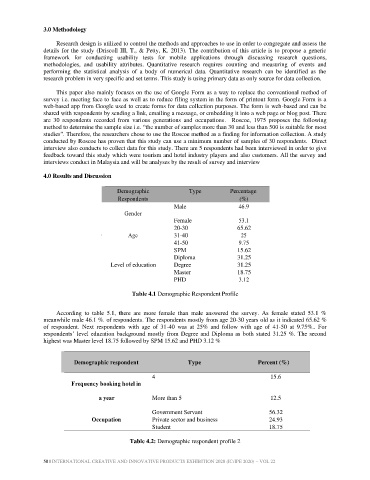
Table 4.1 Demographic Respondent Profile
According to table 5.1, there are more female than male answered the survey. As female stated 53.1 %
meanwhile male 46.1 %. of respondents. The respondents mostly from age 20-30 years old as it indicated 65.62 %
of respondent. Next respondents with age of 31-40 was at 25% and follow with age of 41-50 at 9.75%.. For
respondents’ level education background mostly from Degree and Diploma as both stated 31.25 %. The second
highest was Master level 18.75 followed by SPM 15.62 and PHD 3.12 %
Demographic respondent Type Percent (%)
4 15.6
Frequency booking hotel in
a year More than 5 12.5
Government Servant 56.32
Occupation Private sector and business 24.93
Student 18.75
Table 4.2: Demographic respondent profile 2
50 | INTERNATIONAL CREATIVE AND INNOVATIVE PRODUCTS EXHIBITION 2020 (ICrIPE 2020) – VOL 22