
Page 122 - SAPEM-Chapter-10-2nd-edition-2014
P. 122
South African Pavement Engineering Manual
Chapter 10: Pavement Design
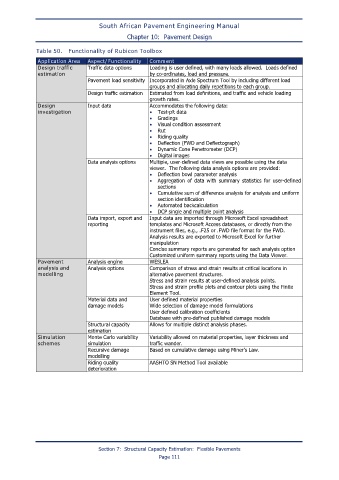
Table 50. Functionality of Rubicon Toolbox
Application Area Aspect/Functionality Comment
Design traffic Traffic data options Loading is user defined, with many loads allowed. Loads defined
estimation by co-ordinates, load and pressure.
Pavement load sensitivity Incorporated in Axle Spectrum Tool by including different load
groups and allocating daily repetitions to each group.
Design traffic estimation Estimated from load definitions, and traffic and vehicle loading
growth rates.
Design Input data Accommodates the following data:
investigation • Test-pit data
• Gradings
• Visual condition assessment
• Rut
• Riding quality
• Deflection (FWD and Deflectograph)
• Dynamic Cone Penetrometer (DCP)
• Digital images
Data analysis options Multiple, user-defined data views are possible using the data
viewer. The following data analysis options are provided:
• Deflection bowl parameter analysis
• Aggregation of data with summary statistics for user-defined
sections
• Cumulative sum of difference analysis for analysis and uniform
section identification
• Automated backcalculation
• DCP single and multiple point analysis
Data import, export and Input data are imported through Microsoft Excel spreadsheet
reporting templates and Microsoft Access databases, or directly from the
instrument files, e.g., .F25 or .FWD file format for the FWD.
Analysis results are exported to Microsoft Excel for further
manipulation
Concise summary reports are generated for each analysis option
Customized uniform summary reports using the Data Viewer.
Pavement Analysis engine WESLEA
analysis and Analysis options Comparison of stress and strain results at critical locations in
modelling alternative pavement structures.
Stress and strain results at user-defined analysis points.
Stress and strain profile plots and contour plots using the Finite
Element Tool.
Material data and User defined material properties
damage models Wide selection of damage model formulations
User defined calibration coefficients
Database with pre-defined published damage models
Structural capacity Allows for multiple distinct analysis phases.
estimation
Simulation Monte Carlo variability Variability allowed on material properties, layer thickness and
schemes simulation traffic wander.
Recursive damage Based on cumulative damage using Miner’s Law.
modelling
Riding quality AASHTO SN Method Tool available
deterioration
Section 7: Structural Capacity Estimation: Flexible Pavements
Page 111