
Page 105 - rise 2017
P. 105
Weight Loss (%) =
where W d is the dry weight of the film after being washed with distilled water, and W i is the initial dry
weight of the specimen.
Results and Discussion
Physical Analysis
All foams were between light brown to dark brown in appearance. The results showed that the fibers
concentration significantly affects the color of tapioca starch based foams. Free rice husk fiber starch-
based foams resulted in white color surface. As the concentration of rice husk fiber increased, the
color surface turned from light brown to dark brown. Besides, the increment of fiber content also
causes the texture of the foams changed from smooth to rough with some cracks.
The average thickness and densities values of all starch-based foams were 4.96-5.04 mm and
3
0.062-0.069 g/cm , respectively. Variations in fiber content did not affect the thickness or density of
starch trays. The values obtained in this work are higher than the values of expanded polystyrene,
3
which were close to 0.06 g/cm [13][14]. However, these density values are lower than those reported
by [11] and [6] for foams made of cassava starch, cellulose fibers and sunflower protein isolate which
3
ranged from 0.46 to 0.59 g/cm and foams made of cassava starch, sugarcane bagasse fibers and
3
montmorillonite, which ranged from 0.1941 to 0.2966 g/cm , respectively.
Mechanical Test
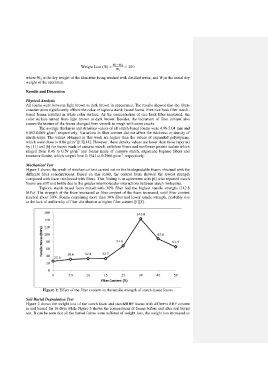
Figure 1 shows the result of mechanical test carried out on the biodegradable foams obtained with the
different fiber concentrations. Based on this result, the control foam showed the lowest strength
compared with foam reinforced with fibers. This finding is in agreement with [6] who reported starch
foams are stiff and brittle due to the greater intermolecular interactions between starch molecules.
Tapioca starch-based foam mixed with 30% fiber had the highest tensile strength (142.8
MPa). The strength of the foam increased as fiber content of the foam increased, until fiber content
reached about 30%. Foams containing more than 30% fiber had lower tensile strength, probably due
to the lack of uniformity of fiber distribution at higher fiber content [1][8].
Figure 1: Effect of the fiber content on the tensile strength of starch-based foams
Soil Burial Degradation Test
Figure 2 shows the weight loss of the starch foam and starch/RHF foams with different RHF content
in soil buried for 16 days while Figure 3 shows the compactness of foams before and after soil burial
test. It can be seen that all the buried foams were suffered of weight loss, the weight loss increased as