
Page 314 - rise 2017
P. 314
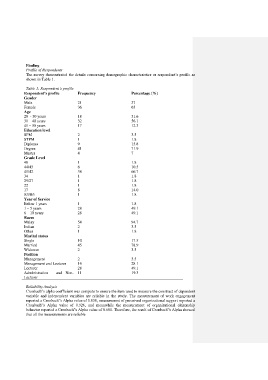
Finding
             Profile of Respondents
             The survey demonstrated the details concerning demographic characteristics or respondent’s profile as
             shown in Table 1.

             Table 1: Respondent’s profile
            Respondent’s profile    Frequency              Percentage (%)
            Gender
            Male                    21                     37
            Female                  36                     63
            Age
            20  - 30 years          18                     31.6
            31 – 40 years           32                     56.1
            41 – 50 years           17                     12.3
            Education level
            SPM                     2                      3.5
            STPM                    1                      1.8
            Diploma                 9                      15.8
            Degree                  41                     71.9
            Master                  4                      7
            Grade Level
            48                      1                      1.8
            44/45                   6                      10.5
            41/42                   38                     66.7
            34                      1                      1.8
            29/27                   1                      1.8
            22                      1                      1.8
            17                      8                      14.0
            R3/R6                   1                      1.8
            Year of Service
            Below 1 years           1                      1.8
            1 – 5 years             28                     49.1
            6 – 10 years            28                     49.1
            Races
            Malay                   54                     94.7
            Indian                  2                      3.5
            Other                   1                      1.8
            Marital status
            Single                  10                     17.5
            Married                 45                     78.9
            Widower                 2                      3.5
            Position
            Management              2                      3.5
            Management and Lecturer   16                   28.1
            Lecturer                28                     49.1
            Administration    and  Non- 11                 19.3
            Lecturer

             Reliability Analysis
             Cronbach‟s alpha coefficient was compute to ensure the item used to measure the construct of dependent
             variable  and  independent  variables  are  reliable  in  the  study.  The  measurement  of  work  engagement
             reported a Cronbach‟s Alpha value of 0.838, measurement of perceived organizational support reported a
             Cronbach‟s  Alpha  value  of  0.926,  and  meanwhile  the  measurement  of  organizational  citizenship
             behavior reported a Cronbach‟s Alpha value of 0.681. Therefore, the result of Cronbach‟s Alpha showed
             that all the measurements are reliable