
Page 1377 - SUBSEC October 2017_Neat
P. 1377
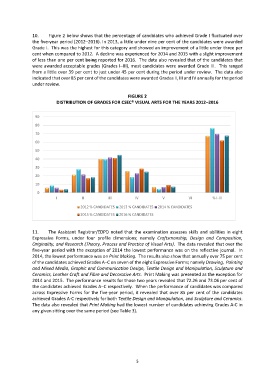
10.     Figure 2 below shows that the percentage of candidates who achieved Grade I fluctuated over
               the five-year period (2012–2016). In 2013, a little under nine per cent of the candidates were awarded
               Grade I.  This was the highest for this category and showed an improvement of a little under three per
               cent when compared to 2012.  A decline was experienced for 2014 and 2015 with a slight improvement
               of less than one per cent being reported for 2016.  The data also revealed that of the candidates that
               were awarded acceptable grades (Grades I–III), most candidates were awarded Grade III.  This ranged
               from a little over 39 per cent to just under 45 per cent during the period under review.  The data also
               indicated that over 85 per cent of the candidates were awarded Grades II, III and IV annually for the period
               under review.

                                                          FIGURE 2
                          DISTRIBUTION OF GRADES FOR CSEC® VISUAL ARTS FOR THE YEARS 2012–2016


                 90
                 80
                 70

                 60
                 50

                 40
                 30
                 20
                 10

                  0
                          I           II         III         IV          V           VI        % I-III

                                     2012 % CANDIDATES  2013 % CANDIDATES  2014 % CANDIDATES
                                     2015 % CANDIDATES  2016 % CANDIDATES


               11.     The Assistant Registrar/EDPD noted that the examination assesses skills and abilities in eight
               Expressive  Forms,  under  four  profile  dimensions;  namely  Craftsmanship,  Design  and  Composition,
               Originality, and Research (Theory, Process and Practice of Visual Arts).  The data revealed that over the
               five-year period with the exception of 2014 the lowest performance was on the reflective journal.  In
               2014, the lowest performance was on Print Making.  The results also show that annually over 75 per cent
               of the candidates achieved Grades A–C on seven of the eight Expressive Forms; namely Drawing,  Painting
               and Mixed Media, Graphic and Communication Design, Textile Design and Manipulation, Sculpture and
               Ceramics, Leather Craft and Fibre and Decorative Arts.  Print Making was presented as the exception for
               2014 and 2015.  The performance results for those two years revealed that 72.26 and 73.06 per cent of
               the candidates achieved Grades A–C respectively.  When the performance of candidates was compared
               across Expressive Forms for the five-year period, it revealed that over 85 per cent of the candidates
               achieved Grades A-C respectively for both Textile Design and Manipulation, and Sculpture and Ceramics.
               The data also revealed that Print Making had the lowest number of candidates achieving Grades A-C in
               any given sitting over the same period (see Table 3).


                                                              5