
Page 1378 - SUBSEC October 2017_Neat
P. 1378
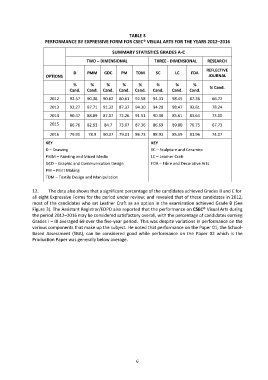
TABLE 3
                     PERFORMANCE BY EXPRESSIVE FORM FOR CSEC® VISUAL ARTS FOR THE YEARS 2012–2016

                                                   SUMMARY STATISTICS GRADES A-C
                                        TWO – DIMENSIONAL             THREE - DIMENSIONAL    RESEARCH

                                                                                             REFLECTIVE
                                  D     PMM    GDC     PM    TDM      SC       LC     FDA
                     OPTIONS                                                                  JOURNAL
                                  %      %      %      %       %       %       %       %      % Cand.
                                Cand.   Cand.  Cand.  Cand.  Cand.   Cand.   Cand.   Cand.

                       2012     92.57   90.38   90.62   80.61   92.58   94.31   98.45   87.36   66.72
                       2013     92.27   87.71   91.32   87.37   94.30   94.28   98.47   93.81   78.24

                       2014     90.47   88.89   87.07   72.26   91.51   90.38   85.61   83.64   73.00
                       2015     86.76   82.93   84.7   73.07   87.36   86.69   89.00   76.75   67.73

                       2016     79.91   78.9   90.07   79.01   86.73   88.93   85.59   81.96   74.07
                     KEY                                            KEY
                     D – Drawing                                    SC – Sculpture and Ceramics
                     PMM – Painting and Mixed Media                 LC – Leather Craft
                     GCD – Graphic and Communication Design         FDA – Fibre and Decorative Arts
                     PM – Print Making
                     TDM – Textile Design and Manipulation


               12.     The data also shows that a significant percentage of the candidates achieved Grades B and C for
               all eight Expressive Forms for the period under review; and revealed that of these candidates in 2012,
               most of the candidates who sat Leather Craft as an option in the examination achieved Grade B (See
               Figure 3). The Assistant Registrar/EDPD also reported that the performance on CSEC® Visual Arts during
               the period 2012–2016 may be considered satisfactory overall, with the percentage of candidates earning
               Grades I – III averaged 69 over the five-year period.  This was despite variations in performance on the
               various components that make up the subject. He noted that performance on the Paper 01, the School-
               Based  Assessment  (SBA),  can  be  considered  good  while  performance  on  the  Paper  02  which  is  the
               Production Paper was generally below average.


                                                              6