Page 180 - SUBSEC October 2017_Neat
P. 180

- 4 -

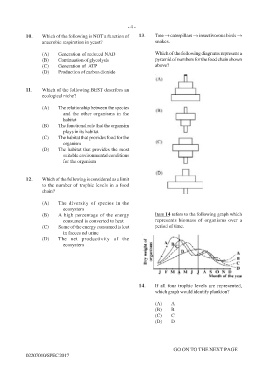
             10.    Which of the following is NOT a function of  13.  Tree → caterpillars → insectivorous birds →
                    anaerobic respiration in yeast?                   snakes.

                    (A)    Generation of reduced NAD                  Which of the following diagrams represent a
                    (B)    Continuation of glycolysis                 pyramid of numbers for the food chain shown
                    (C)    Generation of  ATP                         above?
                    (D)    Production of carbon dioxide


             11.    Which of the following BEST describes an
                    ecological niche?

                    (A)    The relationship between the species
                             and the other organisms in the
                             habitat
                    (B)    The functional role that the organsim
                             plays in its habitat
                    (C)    The habitat that provides food for the
                             organism
                    (D)    The habitat that provides the most
                             suitable environmental conditions
                             for the organism


             12.    Which of the following is considered as a limit
                    to the number of trophic levels in a food
                    chain?


                    (A)    The diversity of species in the
                             ecosystem
                    (B)    A high percentage of the energy            Item 14 refers to the following graph which
                             consumed is converted to heat            represents biomass of organisms over a
                    (C)    Some of the energy consumed is lost        period of time.
                             in faeces nd urine
                    (D)    The net productivity of the
                             ecosystem


                                                               14.    If all four trophic levels are represented,
                                                                      which graph would identify plankton?


                                                                      (A)    A
                                                                      (B)    B
                                                                      (C)    C
                                                                      (D)    D


                                                                              GO ON TO THE NEXT PAGE
             02207010/SPEC 2017
   175   176   177   178   179   180   181   182   183   184   185