
Page 176 - SUBSEC October 2017_Neat
P. 176
- 8 -
02107032/CAPE/SPEC/KMS 2017
BIOLOGY
UNIT 1 -- PAPER 032
MARK SCHEME
Question 3. (continued) UK XS
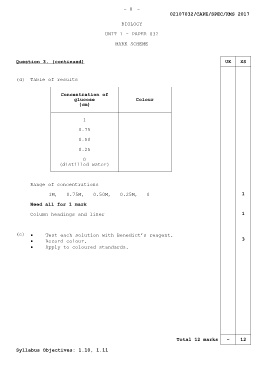
(d) Table of results
Concentration of
glucose Colour
(cm)
1
0.75
0.50
0.25
0
(distilled water)
Range of concentrations
1M, 0.75M, 0.50M, 0.25M, 0 1
Need all for 1 mark
Column headings and liner 1
(e) Test each solution with Benedict’s reagent.
Record colour. 3
Apply to coloured standards.
Total 12 marks - 12
Syllabus Objectives: 1.10, 1.11