
Page 714 - SUBSEC October 2017_Neat
P. 714
- 10 -
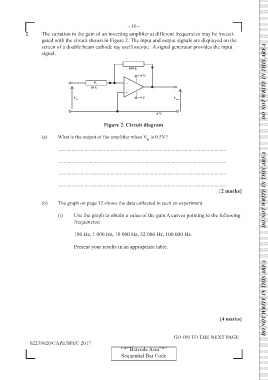
2. The variation in the gain of an inverting amplifier at different frequencies may be investi-
gated with the circuit shown in Figure 2. The input and output signals are displayed on the
screen of a double beam cathode ray oscilloscope. A signal generator provides the input
signal. DO NOT WRITE IN THIS AREA
Figure 2. Circuit diagram
(a) What is the output of the amplifier when V is 0.5V?
in
.................................................................................................................................
.................................................................................................................................
................................................................................................................................. DO NOT WRITE IN THIS AREA
.................................................................................................................................
[2 marks]
(b) The graph on page 12 shows the data collected in such an experiment.
(i) Use the graph to obtain a value of the gain A curves pointing to the following
frequencies:
100 Hz, 1 000 Hz, 10 000 Hz, 32 000 Hz, 100 000 Hz.
Present your results in an appropriate table.
DO NOT WRITE IN THIS AREA
[4 marks]
GO ON TO THE NEXT PAGE
02238020/CAPE/SPEC 2017
‘‘*’’Barcode Area”*”
Sequential Bar Code