
Page 260 - Bahrain Gov Annual Reports (IV)_Neat
P. 260
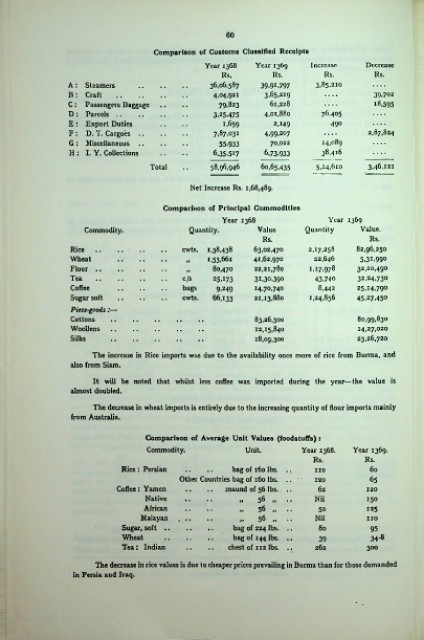
60

                                   Comparison of Customs Classified Receipts
                                              Year 1368 Year 1369 Increase       Decrease
                                                 Rs.        Rs.         Rs.        Rs.
                A: Steamers                    36.06,587  39>9l>797   3.85.210
                n: Craft                        4.04.921   3.65.219                39.702
                C: Passengers Baggage            79.823     61,228                 18.595
                D: Parcels ..                   3.25.475   4,01,880    76.405
                E: Export Duties                  1.659      2,149       490
                F: D. T. Cargoes ..             7.87.031   4.99.207              2.87.824
                G: Miscellaneous ..              55.933     70,022     14,089
                H : I. Y. Collections           6.35.517   6.73.933    38.416
                                  Total        58,96,946  60,65.435   5.14,610   3.46.121

                                          Net'Increase Rs. 1,68,489.

                                     Comparison of Principal Commodities
                                                 Year 1368               Year 1369
                   Commodity.             Quantity.      Value      Quantity    Value.
                                                          Rs.                     Rs.
                Rice ..                  cwts.  1,38,438  63.02,470  2,17,258  82,96,250
                Wheat                     1.  i.53.66i   41,62,970    22,646    5.31.990
                Flour ..                       80,470   22,21,780   1.17.978   32,20,490
                Tea                      c/s   25.173   31.30.390     43.740   32.24,730
                Coffee                   bags   9,249   14.70.740     8.442    25.14.790
                Sugar soft               cwts.   66,133  21,13,880  1,24.856   45.27.450
                Piece-goods:—
                Cottons                                  83.26,500             80,99,830
                Woollens                                 12,15,840             14,27,020
                Silks                                    18,09,300             23.26,720
                     The increase in Rice imports w;is due to the availability once more of rice from Burma, and
                also from Siam.
                     It will be noted that whilst less coffee was imported during the year—the value is
                almost doubled.
                     The decrease in wheat imports is entirely due to the increasing quantity of flour imports mainly
                from Australia.

                                 Comparison of Average Unit Values (foodstuffs) :
                                 Commodity.           Unit.        Year 1368.  Year 1369.
                                                                     Rs.         Rs.
                           Rice: Persian  ..   .. bag of 160 lbs.     no          60
                                        Other Countries bag of 160 lbs. •   120   65
                          Coffee: Yamcn           maund of 56 lbs.    62         120
                                 Native                  56 „         Nil        150
                                                     99
                                African              99  56 „          50        125
                                Malayan              99  56 ..        Nil        no
                            Sugar, soft ..          bag of 224 lbs.    80         95
                            Wheat                   bag of 144 lbs.    39         34-8
                            Tea: Indian            chest of 112 lbs.  262        300
                      The decrease in rice values is due to cheaper prices prevailing in Burma than for those demanded
                 in Persia and Iraq.