
Page 89 - BAA CAFR 2017
P. 89
7,365,856 597,959 414,254 258,990 568,442 9,205,501 12,615,023 12,615,023 1,986,264 262,755 5,991,920 402,274 8,643,213 9,266,125 959,063 340,322 77,928 10,643,438 120,000 275,295 879,243 183,964 1,458,502 82,578 110,749 1,070,274 1,263,601 43,829,278
2017
$ $
7,430,336 589,742 411,821 259,688 581,493 9,273,080 12,984,370 12,984,370 1,823,822 279,327 6,254,853 425,936 8,783,938 9,095,656 971,064 327,774 47,696 10,442,190 200,851 275,295 911,477 158,263 1,545,886 95,046 176,519 745,166 1,016,731 44,046,195
2016
$ $
9,312,392 540,766 364,318 436,801 642,073 11,296,350 12,764,253 12,764,253 1,669,687 219,381 4,761,518 407,410 7,057,996 9,045,201 1,172,092 312,429 59,895 10,589,617 120,000 275,295 905,862 144,719 1,445,876 109,540 339,754 450,144 899,430 44,053,522
2015
$ $
7,783,870 500,283 342,920 644,573 537,096 9,808,742 12,545,705 12,545,705 1,490,973 177,869 4,509,543 351,702 6,530,087 8,354,275 877,418 304,531 7,091 9,543,315 125,000 275,295 898,285 142,895 1,441,475 107,268 285,791 515,841 908,900 40,778,224
2014
$ $
5,282,069 493,446 262,019 593,077 486,046 7,116,657 13,115,821 13,115,821 1,199,037 41,772 4,841,917 218,575 6,301,301 7,715,210 725,314 304,626 10,359 8,755,509 150,000 275,295 991,428 142,821 1,559,544 75,818 255,401 363,093 694,312 37,543,144
2013
$ $
4,732,833 493,446 256,394 605,666 451,203 6,539,542 13,048,872 13,048,872 1,164,766 88,585 5,069,106 202,981 6,525,438 7,615,115 650,717 307,698 19,361 8,592,891 195,000 275,295 820,068 142,822 1,433,185 344,633 208,021 186,934 739,588 36,879,516
2012
$ $
3,826,955 497,350 324,435 582,553 372,133 5,603,426 13,099,652 13,099,652 1,145,912 45,774 4,580,884 177,536 5,950,106 5,800,282 441,037 326,802 16,538 6,584,659 419,149 281,095 796,047 146,852 1,643,143 190,108 192,238 242,870 625,216 33,506,202
2011
$ $ 4) Fuel Farms, Alabama National Guard, Reimbursement Utilities, RON, F
3,855,831 491,146 379,515 709,900 372,555 5,808,947 13,224,807 13,224,807 1,102,214 99,481 5,580,409 193,419 6,975,523 5,690,851 422,068 316,556 35,370 6,464,845 546,233 265,760 785,630 152,821 1,750,444 386,589 180,531 200,198 767,318 34,991,884 3) Taxi Fees, Ground Transporation, FBO Fees, Vending Machines, ATMs, and Airlines Services
2010
$ $
3,475,702 463,667 387,037 623,990 392,973 5,343,369 12,835,802 12,835,802 1,126,714 131,624 5,528,587 279,015 7,065,940 5,986,565 480,434 329,578 21,080 6,817,657 611,257 305,411 771,591 107,471 1,795,730 309,500 178,232 177,316 665,048 34,523,546 1) Space Rentals, Baggage Handling Sytem, and Jet Bridges
2009
$ $ Source: Birmingham Airport Authority Records 2) Food and Beverage, and
3,242,961 437,655 377,475 649,257 372,393 5,079,741 13,371,460 13,371,460 1,317,447 188,333 5,639,735 296,870 7,442,385 5,463,756 503,289 431,091 17,934 6,416,070 501,335 319,154 765,891 163,708 1,750,088 210,047 191,630 106,385 508,062 34,567,806
2008
$ $ Notes:
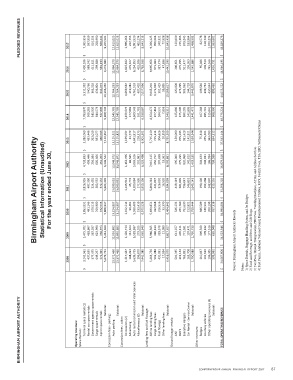
Terminal space rentals (1) Rental car space rentals Government agency space rentals Cargo space rentals Apron space rentals Subtotal: Subtotal: Concessions (2) Auto rental commission and Valet Services Miscellaneous (3) Subtotal: Airline landing fees Cargo landing fees Other landing fees Subtotal: Executive Hangars Car Rental ‐ Service Center Subtotal: Courtesy vehicles Other operating revenues (4) Subtotal:
Operating revenues: Space Rentals: Concession fees ‐ parking: Auto parking Concession fees ‐ other: Advertising Landing fees and fuel flowage: Fuel flowage Ground hangar rentals: AAII FBO'S Other revenues: Badges TOTAL OPERATING REVENUES