
Page 7 - 20180326 Gender Pay Gap Final V1
P. 7
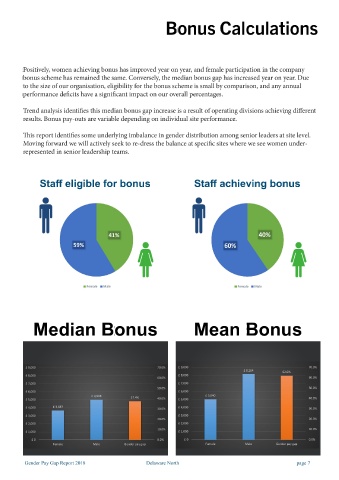
Gender Distribution                                       Bonus Calculations


 “We are flexible, adaptable and able   Positively, women achieving bonus has improved year on year, and female participation in the company
         bonus scheme has remained the same. Conversely, the median bonus gap has increased year on year. Due
 to attract, support and retain women   to the size of our organisation, eligibility for the bonus scheme is small by comparison, and any annual
         performance deficits have a significant impact on our overall percentages.
 within our business at all levels”  Trend analysis identifies this median bonus gap increase is a result of operating divisions achieving different


         results. Bonus pay-outs are variable depending on individual site performance.
 Doug Tetley, Managing Director, Delaware North UK

         This report identifies some underlying imbalance in gender distribution among senior leaders at site level.
         Moving forward we will actively seek to re-dress the balance at specific sites where we see women under-
         represented in senior leadership teams.


 Quartile 1   Quartile 2

 £7.20-£8.40  £8.40-£8.90  Staff eligible for bonus                  Staff achieving bonus


                                        29                                                   18
 47.9%  49.2%             41

                                                                                   31
 52.1%  50.8%


                               Female  Male                                         Female  Male

 Female  Male  Female  Male


 Quartile 3   Quartile 4   Median Bonus                              Mean Bonus

 £8.90 - £9.21  £9.21 - £112.78


                            Median Bonus                                          Mean Bonus
          £ 9,000                                       70.0%   £ 9,000                                      70.0%
                                                                                       £ 8,164      62.0%
          £ 8,000                                               £ 8,000
                                                        60.0%                                                60.0%
          £ 7,000                                               £ 7,000
 42.5%  44.2%  £ 6,000                                  50.0%   £ 6,000  £ 5,040                             50.0%
          £ 5,000                £ 4,998       37.4%    40.0%   £ 5,000                                      40.0%

 57.5%  55.8%  £ 4,000  £ 3,637                         30.0%   £ 4,000                                      30.0%
                                                                £ 3,000
          £ 3,000
                                                        20.0%                                                20.0%
          £ 2,000                                               £ 2,000
                                                        10.0%                                                10.0%
          £ 1,000                                               £ 1,000
            £ 0                                         0.0%      £ 0                                        0.0%
                    Female        Male       Gender pay gap              Female        Male       Gender pay gap
 Female  Male  Female  Male
 Gender Pay Gap Report 2018   Delaware North   page 6   Gender Pay Gap Report 2018   Delaware North      page 7