
Page 228 - Board Member Onboardin August 2019
P. 228
PROCUREMENT
IHOP MARKET BASKET
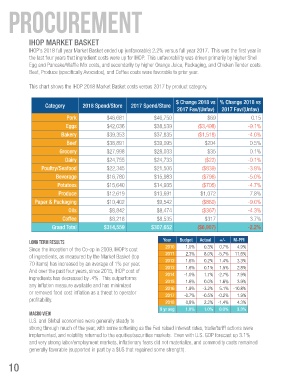
IHOP’s 2018 full year Market Basket ended up (unfavorable) 2.2% versus full year 2017. This was the first year in
the last four years that ingredient costs were up for IHOP. This unfavorability was driven primarily by higher Shell
Egg and Pancake/Waffle Mix costs, and secondarily by higher Orange Juice, Packaging, and Chicken Tender costs.
Beef, Produce (specifically Avocados), and Coffee costs were favorable to prior year.
This chart shows the IHOP 2018 Market Basket costs versus 2017 by product category.
$ Change 2018 vs % Change 2018 vs
Category 2018 Spend/Store 2017 Spend/Store
2017 Fav/(Unfav) 2017 Fav/(Unfav)
Pork $46,681 $46,750 $69 0.15
Eggs $42,036 $38,539 ($3,498) -9.1%
Bakery $39,353 $37,835 ($1,518) -4.0%
Beef $38,891 $39,095 $204 0.5%
Grocery $27,998 $28,033 $35 0.1%
Dairy $24,755 $24,733 ($22) -0.1%
Poultry/Seafood $22,345 $21,506 ($839) -3.9%
Beverage $16,780 $15,983 ($796) -5.0%
Potatoes $15,640 $14,935 ($705) -4.7%
Produce $12,619 $13,691 $1,072 7.8%
Paper & Packaging $10,402 $9,542 ($860) -9.0%
Oils $8,842 $8,474 ($367) -4.3%
Coffee $8,218 $8,535 $317 3.7%
Grand Total $314,559 $307,652 ($6,907) -2.2%
Year Budget Actual +/- M-PPI
LONG TERM RESULTS
Since the inception of the Co-op in 2009, IHOP’s cost 2010 1.0% 0.3% 0.7% 4.9%
of ingredients, as measured by the Market Basket (top 2011 2.3% 8.0% -5.7% 11.6%
70 items) has increased by an average of 1% per year. 2012 1.6% 0.2% 1.4% 3.3%
2013
1.6%
2.8%
1.5%
0.1%
And over the past four years, since 2015, IHOP cost of 2014 -1.0% 1.7% -2.7% 7.9%
ingredients has decreased by .4%. This outperforms 2015 1.6% 0.0% 1.6% 3.9%
any inflation measure available and has minimized 2016 1.9% -3.2% 5.1% -10.8%
or removed food cost inflation as a threat to operator 2017 -0.7% -0.5% -0.2% 1.9%
profitability. 2018 0,8% 2.2% -1.4% 4.3%
9 yr avg 1.0% 1.0% 0.0% 3.3%
MACRO VIEW
U.S. and Global economies were generally steady to
strong through much of the year, with some softening as the Fed raised interest rates, trade/tariff actions were
implemented, and volatility returned to the equities/securities markets. Even with U.S. GDP forecast up 3.1%
and very strong labor/employment markets, inflationary fears did not materialize, and commodity costs remained
generally favorable (supported in part by a $US that regained some strength).
10