
Page 267 - Aida Hovsepian Onboarding
P. 267
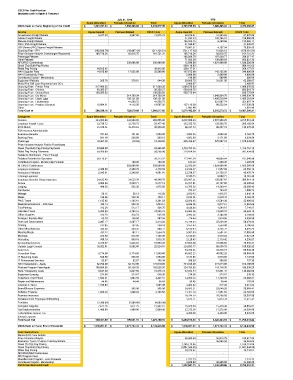
CSCS Net Cash Position
(Includes cash in Apple & Pancake)
July 31, 2018 YTD
Apple Allocation Pancake Allocation Total Apple Allocation Pancake Allocation Total
CSCS Cash on Hand, Beginning of the month $ 1,861,221.34 $ 1,558,295.92 $ 3,419,517.26 $ 2,791,735.53 $ 1,680,495.34 $ 4,472,230.87
Source Apple Related Pancake Related CSCS Total Apple Related Pancake Related CSCS Total
Arrowstream Freight Rebate 9,477.20 3,397.95 12,875.15 50,016.41 31,953.65 81,970.06
Glazier Freight Rebate - 41,234.43 108,765.57 150,000.00
McLane Freight Rebate - 186,525.15 6,460.96 192,986.11
SSA / FSA Freight Rebate - 31,538.07 - 31,538.07
USF,Kinexo,PFG,Sygma Freight Rebates - 73,861.31 4,197.34 78,058.65
Sourcing Fees - RPI (462,828.78) (48,607.43) (511,436.21) (731,117.42) 54,636.18 (676,481.24)
Price Variance Analysis Overcharges Recovered 108,718.56 56,012.75 164,731.31 108,718.56 56,012.75 164,731.31
Patronage Rebates - 192,996.70 197,220.77 390,217.47
Other Rebates - 71,932.50 130,698.83 202,631.33
NFC/RBC Conferences 239,000.00 239,000.00 12,500.00 1,024,000.00 1,036,500.00
Steak (Top Butt) Peg Pricing - 900,116.63 - 900,116.63
Riblet Peg Pricing 49,015.95 49,015.95 350,177.51 - 350,177.51
HAVI Supplier Fees 14,875.00 17,625.00 32,500.00 197,875.00 142,125.00 340,000.00
HAVI Connectivity Fees - 2,000.00 2,000.00 4,000.00
Contributed Capital - Membership - 100.00 500.00 600.00
Equipment Rebates 265.78 378.61 644.39 30,666.72 31,621.95 62,288.67
Wood Fire Grill Loan Payments from DC's - 2,460.07 2,460.07
Sourcing Fees - French Fries 317,009.25 317,009.25 1,900,576.83 1,900,576.83
Sourcing Fees - Chicken 95,355.27 95,355.27 683,810.76 683,810.76
Sourcing Fees - Ground Beef 138,955.62 138,955.62 836,775.64 836,775.64
Sourcing Fees - Dry Mixes 214,769.34 214,769.34 1,648,934.70 1,648,934.70
Sourcing Fees - Liquid Eggs 195,121.80 195,121.80 1,495,216.04 1,495,216.04
Sourcing Fees - Hashbrowns 41,268.72 41,268.72 321,007.74 321,007.74
Sourcing Fees - Produce (Danaco) 15,694.31 4,112.95 19,807.26 127,116.26 60,222.24 187,338.50
Other - 1,601.46 - 1,601.46
Total Cash In $ 286,538.16 $ 723,079.69 $ 1,009,617.85 $ 5,071,482.59 $ 5,315,573.72 $ 10,387,056.31
Categories Apple Allocation Pancake Allocation Total Apple Allocation Pancake Allocation Total
Salaries 131,902.98 131,903.00 263,805.98 2,007,909.24 2,007,909.25 4,015,818.49
Employer Payroll Taxes 12,738.72 12,738.73 25,477.45 132,582.78 132,582.76 265,165.54
401K Match 15,479.61 15,479.61 30,959.22 68,237.72 68,237.74 136,475.46
FSA Account Administration - - - -
Executive Benefits 791.63 791.62 1,583.25 4,882.36 4,882.34 9,764.70
Banking Fees 601.10 298.09 899.19 4,062.90 2,171.60 6,234.50
Patronage 10,467.28 (18.63) 10,448.65 695,356.67 875,587.18 1,570,943.85
Price Variance Analysis Paid to Franchisees - - - -
Steak (Top Butt) Peg Pricing Payments 23,865.80 23,865.80 1,413,754.15 - 1,413,754.15
Riblet Peg Pricing Payments 50,268.00 50,268.00 301,434.00 - 301,434.00
Rebate to Distributors - Pass Through - - - -
Rebates Refunded to Operators 56,113.32 56,113.32 117,441.34 49,899.64 167,340.98
Contributed Capital - Membership Refunds 100.00 100.00 100.00 1,300.00 1,400.00
NFC/RBC Conferences 359,000.00 359,000.00 12,500.00 1,024,000.00 1,036,500.00
Employee Relations 2,389.80 2,389.79 4,779.59 11,594.17 11,957.99 23,552.16
Restaurant Visitation 2,345.51 2,345.50 4,691.01 21,738.37 21,738.37 43,476.74
Training Expenses - 9,580.75 9,580.71 19,161.46
Employee Benefits-Group Insurance 24,623.40 24,623.39 49,246.79 192,907.11 192,907.07 385,814.18
Airfare 3,086.48 5,590.71 8,677.19 16,767.81 22,727.85 39,495.66
Lodging 480.36 595.32 1,075.68 14,785.02 14,203.41 28,988.43
Car Rental - 794.37 794.37 1,588.74
Mileage 56.15 56.13 112.28 1,030.43 1,015.67 2,046.10
Meals 196.66 232.48 429.14 2,523.01 2,940.44 5,463.45
PWC Travel 1,195.62 1,195.61 2,391.23 12,504.45 12,504.38 25,008.83
Meals/Entertainment - 50% Ded 495.13 558.38 1,053.51 6,846.05 8,017.61 14,863.66
Taxi/Parking 313.58 513.17 826.75 3,184.80 4,564.87 7,749.67
Glendale Travel 5,492.99 4,792.16 10,285.15 23,802.06 19,622.07 43,424.13
Office Supplies 312.76 312.74 625.50 2,092.02 2,102.80 4,194.82
Postage / Express Mail 68.74 138.60 207.34 724.64 1,514.86 2,239.50
Dues and Subscriptions 2,207.17 2,207.17 4,414.34 25,239.43 25,239.39 50,478.82
Printing 132.05 132.05 264.10 1,553.43 1,553.40 3,106.83
Other Miscellaneous 344.36 344.35 688.71 6,160.53 3,165.72 9,326.25
Meeting Meals 782.12 782.11 1,564.23 5,501.99 5,501.91 11,003.90
Meetings 872.50 872.50 1,745.00 5,510.65 5,510.64 11,021.29
Recruiting 959.19 959.16 1,918.35 2,119.45 2,119.42 4,238.87
Accounting Services 5,416.67 5,416.66 10,833.33 37,666.68 37,666.63 75,333.31
Outside Legal Counsel 16,922.01 5,602.00 22,524.01 114,895.77 65,630.75 180,526.52
Audit fees - 34,472.21 34,472.19 68,944.40
Consultant Fees 5,774.50 5,774.50 11,549.00 40,002.25 40,002.25 80,004.50
IT Recurring Costs 526.50 526.50 1,053.00 3,573.85 3,573.83 7,147.68
IT Professional Services 52.67 52.67 105.34 368.69 368.69 737.38
HAVI Subscription - Apple 62,798.00 52,712.00 115,510.00 444,816.00 374,674.00 819,490.00
Produce Program Fees-Apple 108,099.85 50,438.35 158,538.20 294,789.85 143,748.35 438,538.20
Rent / Occupancy Costs 9,637.59 9,637.59 19,275.18 67,651.44 67,651.44 135,302.88
Equipment Leasing 274.68 274.67 549.35 274.68 274.67 549.35
Telephone / Cell Phone 1,663.51 1,663.50 3,327.01 11,450.12 11,450.09 22,900.21
Repair and Maintenance 44.45 44.44 88.89 89.45 89.44 178.89
Licenses & Taxes 1,595.00 1,595.00 2,402.42 817.42 3,219.84
Board/Director Expenses 385.00 385.00 24,963.21 25,640.20 50,603.41
Software Expense 1,398.29 1,398.29 2,796.58 11,361.54 11,361.52 22,723.06
Business Insurance - 28,298.50 28,298.50 56,597.00
Donations from Employee Withholding - 5,813.71 5,613.70 11,427.41
Penalties (2,300.00) (2,300.00) (4,600.00) - - -
Computer Supplies 7,671.26 7,671.25 15,342.51 15,429.54 15,429.48 30,859.02
Havi Implementation 1,400.00 1,400.00 2,800.00 17,275.00 17,275.00 34,550.00
Federal/State Income Tax - 4,200.00 4,433.00 8,633.00
Interest Expense - - - -
Total Cash Out 569,557.99 $ 709,631.16 $ 1,279,189.15 $ 6,285,016.61 $ 5,424,324.61 $ 11,709,341.22
CSCS Cash on Hand, End of the month $ 1,578,201.51 $ 1,571,744.45 $ 3,149,945.96 $ 1,578,201.51 $ 1,571,744.45 $ 3,149,945.96
Cash Restrictions Apple Allocation Pancake Allocation Total
Maines $.07 Case Rebate -
Price Variance Analysis 52,605.24 56,012.75 108,617.99
Basciana / Tyson / Custom Culintary Rebate 36,863.04 36,863.04
Steak (Tri Tip) Peg Pricing 1,165,113.56 1,165,113.56
Steak (Top Butt) Peg Pricing (1,001,544.25) (1,001,544.25)
Riblet Peg Pricing 48,743.51 48,743.51
NFC/RBC/BIM Conferences - - -
RPI Program Fees -
Woodfire Grill Program - Loan Proceeds 1,741.74 1,741.74
Contributed Capital - Membership 3,600.00 30,600.00 34,200.00
CSCS Non Restricted Cash $ 1,307,941.71 $ 1,448,268.66 $ 2,756,210.37