
Page 361 - Onboarding May 2017
P. 361
Confidential and Privileged
For The Audit and Finance Committee's Review
Work-paper #3-5:
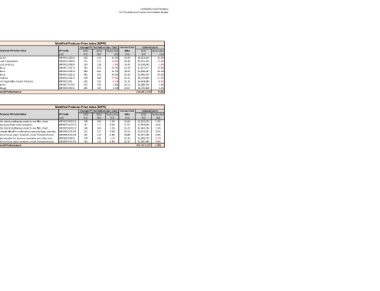
Apple Market Basket vs. Modified Producer Price Index:
2016 Performance by Category
Category: Produce
Apple Market Basket Modified Producer Price Index (MPPI)
Average Actual Store Cost (Jan - Dec) Budgeted Spend Average PPI Sub-Indices (Jan - Dec) Indexed Cost Indexed Spend
Product 2015 2016 fav/(unfav) Volume 2016 2015 2016 fav/(unfav) Referenced PPI Sub-Indices PPI Code 2015 2016 fav/(unfav) 2016 2016 fav/(unfav)
[1] [2] [3] [4] [5] [6] [7] [8] [9] [10] [11] [12] [13] [14] [15] [16]
Broccoli Florets, 6/3 lbs $1.33 $1.31 1.4% 4,221,749 $5,600,854 $5,523,455 1.4% Broccoli WPU01130222 220 150 31.9% $0.90 $3,814,505 31.9%
Potatoes, Red, A $0.32 $0.31 1.3% 15,311,884 $4,861,523 $4,797,724 1.3% Round red potatoes WPU01130604 151 171 -13.8% $0.36 $5,534,454 -13.8%
Potatoes, Russet, Baker $0.39 $0.44 -12.3% 7,782,420 $3,015,688 $3,385,353 -12.3% Russet potatoes WPU01130603 124 128 -2.8% $0.40 $3,100,993 -2.8%
Romaine (Chopped) $1.37 $1.29 6.1% 2,080,433 $2,857,706 $2,682,025 6.1% Lettuce WPU01130215 419 242 42.3% $0.79 $1,647,571 42.3%
Romaine (Whole Head) $0.55 $0.56 -1.1% 11,356,337 $6,293,303 $6,359,549 -1.1% Lettuce WPU01130215 419 242 42.3% $0.32 $3,628,317 42.3%
Lettuce, Iceberg 24 count $0.51 $0.49 2.8% 6,332,191 $3,208,310 $3,118,604 2.8% Lettuce WPU01130215 419 242 42.3% $0.29 $1,849,707 42.3%
Tomatoes 5x6s, 6x7s $0.95 $0.85 10.0% 6,335,683 $6,008,339 $5,406,449 10.0% Tomatoes WPU01130217 203 280 -37.8% $1.31 $8,279,890 -37.8%
Mushrooms, Sliced Whites $1.75 $1.80 -2.7% 3,221,864 $5,638,262 $5,791,301 -2.7% Fresh Vegetables, Except Potatoes WPU011302 225 225 -0.1% $1.75 $5,641,814 -0.1%
Lemons $0.14 $0.15 -7.1% 27,044,654 $3,808,789 $4,079,235 -7.1% Lemons WPU01110104 354 333 5.8% $0.13 $3,588,499 5.8%
Shred Cabbage, Green $0.69 $0.69 0.7% 10,114,590 $6,979,067 $6,928,494 0.7% Cabbage WPU01130211 247 239 3.3% $0.67 $6,745,600 3.3%
Overall Performance $48,271,841 $48,072,188 0.4% Overall Performance $43,831,349 9.2%
Category: Paper & Packaging
Apple Market Basket Modified Producer Price Index (MPPI)
Average Actual Store Cost (Jan - Dec) Budgeted Spend Average PPI Sub-Indices (Jan - Dec) Indexed Cost Indexed Spend
Product 2015 2016 fav/(unfav) Volume 2016 2015 2016 fav/(unfav) Referenced PPI Sub-Indices PPI Code 2015 2016 fav/(unfav) 2016 2016 fav/(unfav)
[1] [2] [3] [4] [5] [6] [7] [8] [9] [10] [11] [12] [13] [14] [15] [16]
Base, 56 oz, Applebee's, Blk PP $1.73 $1.54 10.8% 2,969,577 $5,131,724 $4,575,585 10.8% Other plastic packaging products, exc film, sheet, WPU072A01012 106 104 1.9% $1.69 $5,033,262 1.9%
Container, Embossed Hinged Foam $1.92 $1.90 1.0% 1,558,066 $2,992,263 $2,961,827 1.0% Polystyrene foam food containers WPU072A01015 111 111 0.0% $1.92 $2,991,813 0.0%
Lid, 9 In, Clr, PP, Lid, APPLEBEES WA $2.47 $2.28 7.7% 1,848,723 $4,569,918 $4,218,100 7.7% Other plastic packaging products, exc film, sheet, WPU072A01012 106 104 1.9% $2.42 $4,482,236 1.9%
Bags, Hybrid , 13"x9"x22" $2.26 $2.08 8.3% 735,033 $1,663,593 $1,526,346 8.3% Multiweb film/film combination specialty bags, pouches WPU091502163 121 117 3.0% $2.20 $1,613,431 3.0%
Dinner Napkins, White (15x16.25) $0.81 $0.79 2.0% 6,901,405 $5,579,175 $5,469,769 2.0% Sanitary tissue paper products, made from purchased WPU091501235 114 113 0.8% $0.80 $5,537,045 0.8%
Paper, Register Receipt, Stock Thermal, 80mmx273 $1.26 $1.26 0.1% 844,758 $1,063,892 $1,062,364 0.1% Paper supplies for business machines and other misc WPU09150655 178 182 -2.3% $1.29 $1,088,570 -2.3%
Napkins, Beverage, Kraft, Printed, Applebee's $1.38 $1.38 -0.4% 780,788 $1,074,091 $1,078,226 -0.4% Sanitary tissue paper products, made from purchased WPU091501235 114 113 0.8% $1.37 $1,065,980 0.8%
Overall Performance $22,074,657 $20,892,216 5.4% Overall Performance $21,812,337 1.2%
Sources & Notes:
[1]: Products are based on Apple Price Index.
[2]: Average actual store cost for 2015 is calculated by taking the average of prices from January 2015 through December 2015.
[3]: Average actual store cost for 2016 is calculated by taking the average of prices from January 2016 through December 2016.
[4]: Change in average actual store cost= -{[3] - [2]}/[2].
[5]: Budgeted volumes for 2016 are based on Apple Price Index. UOM is pound.
[6]: [2] x [5].
[7]: [3] x [5].
[8]: -{[7] - [6]}/[6]. Notice that [4] & [8] have the same results.
[9]: PPI sub-indices are selected based on resemblance with products in Apple Market Basket.
[10]: See PPI Codes on the Bureau of Labor Statistics: http://www.bls.gov/news.release/pdf/ppi.pdf
[11]: Data were retrieved from the Bureau of Labor Statistic website: http://data.bls.gov/cgi-bin/srgate
[12]: Data were retrieved from the Bureau of Labor Statistic website: http://data.bls.gov/cgi-bin/srgate
[13]: Change in PPI sub-indices = -{[12] - [11]}/[11].
[14]: [2] x {1 - [13]}.
[15]: [5] x [14].
[16]: -{[15] - [6]}/[6]. Notice that [13] & [16] have the same results.