
Page 359 - Onboarding May 2017
P. 359
Confidential and Privileged
For The Audit and Finance Committee's Review
Work-paper #3-4:
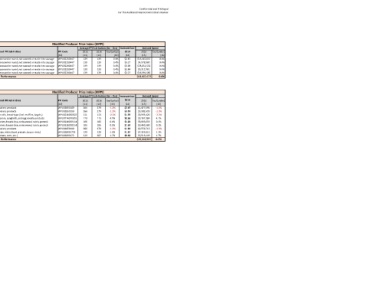
Apple Market Basket vs. Modified Producer Price Index:
2016 Performance by Category
Category: Pork
Apple Market Basket Modified Producer Price Index (MPPI)
Average Actual Store Cost (Jan - Dec) Budgeted Spend Average PPI Sub-Indices (Jan - Dec) Indexed Cost Indexed Spend
Product 2015 2016 fav/(unfav) Volume 2016 2015 2016 fav/(unfav) Referenced PPI Sub-Indices PPI Code 2015 2016 fav/(unfav) 2016 2016 fav/(unfav)
[1] [2] [3] [4] [5] [6] [7] [8] [9] [10] [11] [12] [13] [14] [15] [16]
Bacon, Raw, Applewood Sliced $2.16 $2.33 -7.6% 7,136,772 $15,435,088 $16,604,258 -7.6% Pork, processed or cured, not canned or made into sausage WPU02210447 139 139 0.4% $2.15 $15,367,657 0.4%
Ham, Black Forest, Sliced, 2P $3.28 $3.24 1.3% 1,400,004 $4,598,992 $4,537,883 1.3% Pork, processed or cured, not canned or made into sausage WPU02210447 139 139 0.4% $3.27 $4,578,900 0.4%
Pork, Baby Back Ribs, Narrow Cut, Raw $3.03 $3.00 1.2% 7,629,204 $23,152,697 $22,879,975 1.2% Pork, processed or cured, not canned or made into sausage WPU02210447 139 139 0.4% $3.02 $23,051,552 0.4%
Pork, Bacon Bits, Fully-Cooked, 30% $3.86 $5.08 -31.6% 1,382,475 $5,336,294 $7,021,241 -31.6% Pork, processed or cured, not canned or made into sausage WPU02210447 139 139 0.4% $3.84 $5,312,981 0.4%
Pork, Riblets, Pre-Cooked (Catch Wt) $2.28 $2.19 3.7% 7,100,004 $16,162,189 $15,567,659 3.7% Pork, processed or cured, not canned or made into sausage WPU02210447 139 139 0.4% $2.27 $16,091,582 0.4%
Overall Performance $64,685,259 $66,611,016 -3.0% Overall Performance $64,402,672 0.4%
Category: Bakery
Apple Market Basket Modified Producer Price Index (MPPI)
Average Actual Store Cost (Jan - Dec) Budgeted Spend Average PPI Sub-Indices (Jan - Dec) Indexed Cost Indexed Spend
Product 2015 2016 fav/(unfav) Volume 2016 2015 2016 fav/(unfav) Referenced PPI Sub-Indices PPI Code 2015 2016 fav/(unfav) 2016 2016 fav/(unfav)
[1] [2] [3] [4] [5] [6] [7] [8] [9] [10] [11] [12] [13] [14] [15] [16]
Blondie, Walnut, NTF $2.63 $2.69 -2.2% 554,112 $1,459,198 $1,491,239 -2.2% Frozen bakery products WPU02850109 266 270 -1.3% $2.67 $1,477,594 -1.3%
Cake, Triple Chocolate Meltdown $3.45 $3.39 1.9% 1,597,212 $5,513,193 $5,409,989 1.9% Frozen bakery products WPU02850109 266 270 -1.3% $3.50 $5,582,699 -1.3%
Bun, Brioche $1.36 $1.29 5.5% 5,026,392 $6,844,720 $6,468,898 5.5% All other rolls, bread-type (incl. muffins, bagels,) WPU0211050502 111 113 -2.2% $1.39 $6,995,420 -2.2%
Pasta, Cavatappi $0.68 $0.62 8.2% 4,899,960 $3,329,613 $3,056,324 8.2% Dry macaroni, spaghetti, and egg noodle products WPU0214020303 120 115 4.1% $0.65 $3,192,384 4.1%
Bread, Potato Pan Select SL 8 Cs $1.23 $1.23 0.3% 3,159,420 $3,888,699 $3,875,970 0.3% Other variety breads (rye, unleavened, raisin, potato) WPU0211020114 106 106 0.1% $1.23 $3,885,653 0.1%
Bun, Ciabatta 4 x 4, Unsliced $1.63 $1.60 1.5% 1,501,440 $2,444,595 $2,408,805 1.5% Other variety breads (rye, unleavened, raisin, potato) WPU0211020114 106 106 0.1% $1.63 $2,442,680 0.1%
Brownie, Blue Ribbon $1.80 $1.84 -1.9% 1,403,196 $2,527,846 $2,575,534 -1.9% Frozen bakery products WPU02850109 266 270 -1.3% $1.82 $2,559,715 -1.3%
Pretzel, Par Baked, Bavarian Flavored $1.90 $1.88 1.0% 3,816,081 $7,235,773 $7,166,550 1.0% Other chips, sticks (hard pretzels, bacon rinds,) WPU028901723 129 128 1.1% $1.87 $7,153,612 1.1%
Tortilla Chip, Pre-cut $0.63 $0.56 10.6% 10,592,904 $6,632,156 $5,929,717 10.6% Chips (potato, corn, etc.) WPU02890172 210 207 1.7% $0.62 $6,519,149 1.7%
Overall Performance $39,875,793 $38,383,026 3.7% Overall Performance $39,808,905 0.2%
Sources & Notes:
[1]: Products are based on Apple Price Index.
[2]: Average actual store cost for 2015 is calculated by taking the average of prices from January 2015 through December 2015.
[3]: Average actual store cost for 2016 is calculated by taking the average of prices from January 2016 through December 2016.
[4]: Change in average actual store cost= -{[3] - [2]}/[2].
[5]: Budgeted volumes for 2016 are based on Apple Price Index. UOM is pound.
[6]: [2] x [5].
[7]: [3] x [5].
[8]: -{[7] - [6]}/[6]. Notice that [4] & [8] have the same results.
[9]: PPI sub-indices are selected based on resemblance with products in Apple Market Basket.
[10]: See PPI Codes on the Bureau of Labor Statistics: http://www.bls.gov/news.release/pdf/ppi.pdf
[11]: Data were retrieved from the Bureau of Labor Statistic website: http://data.bls.gov/cgi-bin/srgate
[12]: Data were retrieved from the Bureau of Labor Statistic website: http://data.bls.gov/cgi-bin/srgate
[13]: Change in PPI sub-indices = -{[12] - [11]}/[11].
[14]: [2] x {1 - [13]}.
[15]: [5] x [14].
[16]: -{[15] - [6]}/[6]. Notice that [13] & [16] have the same results.